The Greenland Gambit: Analyzing the Trillion-Dollar Fallout of Trump’s “Arctic Tax” on Apple, Tesla, and Boeing

The geopolitical landscape was set ablaze on January 17, 2026, when President Donald Trump utilized his social media platform to issue a seismic trade ultimatum that has sent shockwaves through global markets. Invoking the “Safety, Security, and Survival of our Planet,” the President announced a 10% tariff on all goods imported from eight European nations—Denmark, Norway, Sweden, France, Germany, the United Kingdom, the Netherlands, and Finland—beginning February 1, 2026. This rate is scheduled to skyrocket to 25% by June 1, 2026, unless a deal is reached for the “complete and total purchase of Greenland.”

The rationale provided by the White House centers on the sudden “unknown” military maneuvers of these eight nations within the Danish autonomous territory. Trump’s post highlighted a 150-year-old American ambition to acquire the island, now escalated by the strategic necessity of the “Golden Dome” missile defense system. In immediate response, the European Union has signaled its intent to retaliate by targeting €93 billion ($101 billion) of U.S. goods and restricting American corporate access to the Single Market.

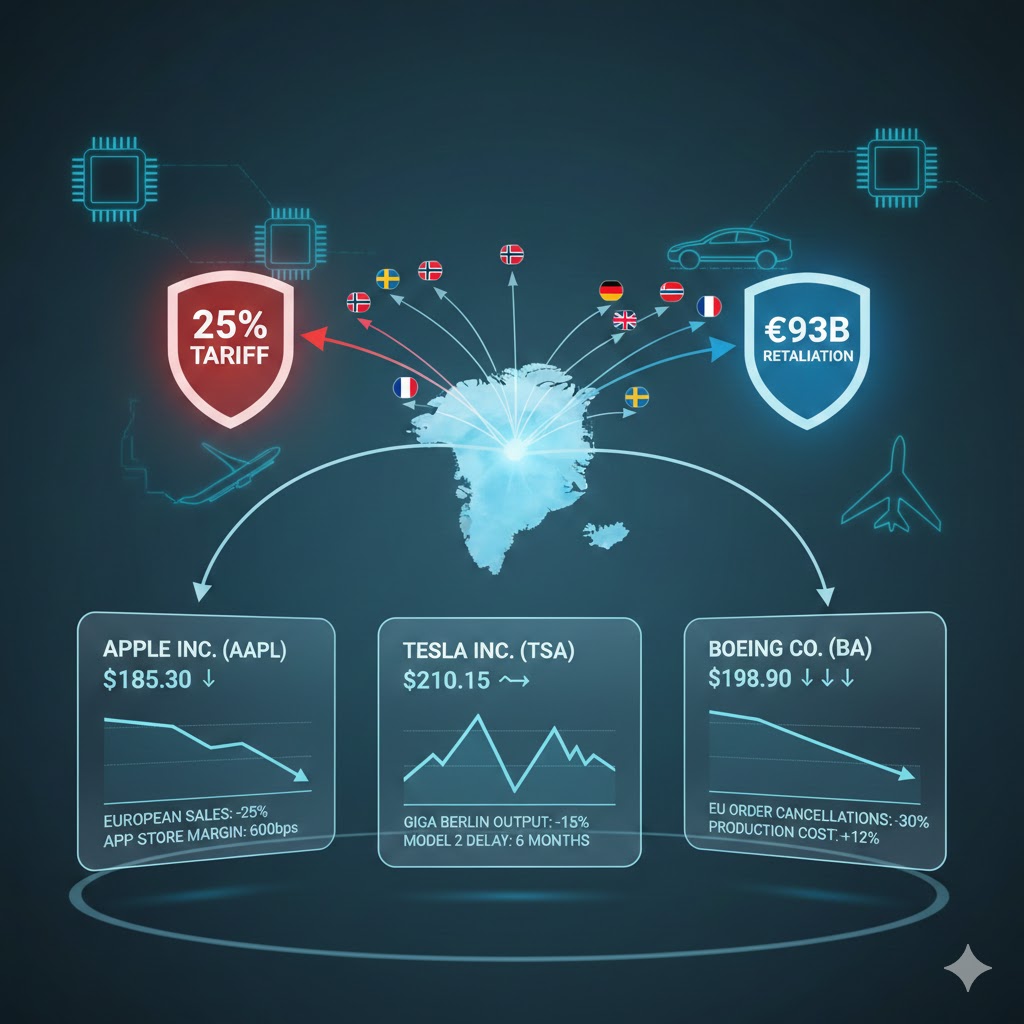
As the “Greenland Gambit” unfolds, the financial implications for U.S. equities are profound. By analyzing revenue exposure, supply chain vulnerabilities, and the specific retaliatory targets of the EU, three stocks emerge as the most exposed to this transatlantic trade war: Apple Inc. (AAPL), Tesla Inc. (TSLA), and The Boeing Company (BA).


Apple Inc. (AAPL): A Two-Front War on Margins and Market Access

[AAPL] stock faces a uniquely precarious situation. While Apple is often viewed through the lens of its Chinese manufacturing base, its European operations are the silent engine of its high-margin services and hardware growth. In fiscal year 2025, Europe accounted for approximately 25% of Apple’s total net sales, reaching nearly $100 billion. The EU’s threat to “restrict American companies from the bloc’s market” strikes directly at Apple’s most lucrative expansion area: the Digital Markets Act (DMA) compliant App Store and its burgeoning AI services.

The Apple (AAPL) stock price has historically been sensitive to trade disruptions, but the Greenland tariffs introduce a “circular” cost pressure. Apple imports a significant array of high-end components and specialized machinery from Germany and the Netherlands (specifically from lithography giant ASML partners) for its domestic R&D and limited U.S.-based assembly. A 25% tariff on these precision tools would inflate the capital expenditure required for Apple’s “Apple Silicon” development.

Financially, Apple’s balance sheet remains robust, with over $160 billion in cash and marketable securities as of their most recent quarterly filing. However, the 2026 guidance already factored in a 5% growth in European hardware sales driven by the “iPhone 17” cycle and the rollout of Apple Intelligence in local languages. If the EU retaliates with a 25% “digital sovereignty tax” or targeted luxury tariffs—a tactic used in previous trade disputes—Apple’s operating margins in the region, which currently hover around 38%, could contract by 400 to 600 basis points.

Furthermore, the “Greenland mission” cited by Trump involves nations that are home to Apple’s primary European data centers (Denmark and Sweden). Regulatory friction or “national security” audits by these governments in response to U.S. pressure could delay the deployment of Apple’s new “Private Cloud Compute” infrastructure. For investors monitoring AAPL stock, the primary risk is not just the cost of goods, but the potential for a “regulatory blockade” that halts the monetization of AI across the European continent.


Tesla Inc. (TSLA): The Giga Berlin Bottleneck and Retaliatory Targets

No company is more physically entrenched in the crosshairs of this dispute than Tesla. With Giga Berlin-Brandenburg serving as its primary European manufacturing hub, Tesla (TSLA) stock is exposed to both the U.S. import tariffs and the EU’s retaliatory list, which specifically mentions “vehicles” as a primary target for the €93 billion counter-strike.

According to Tesla’s 2025 annual report, the company has successfully ramped production at Giga Berlin to an annual run rate of 600,000 vehicles. However, the facility remains heavily dependent on specialized parts and power electronics imported from the United States, as well as the export of specialized Model Y variants back to the North American market to satisfy specific trim demands. The proposed 25% U.S. tariff on German-made goods would effectively end the viability of importing European-made Teslas into the U.S., while the EU’s retaliatory tariffs would hit Tesla’s U.S.-made Model S and Model X exports to Europe.

The Tesla (TSLA) stock price recently saw volatility following the announcement, as investors digested the impact on the “Model 2” (the $25,000 next-generation vehicle) development timeline. Tesla had planned for a simultaneous global rollout in 2026, with Giga Berlin playing a lead role in the European market entry. If trade barriers rise, Tesla may be forced to bifurcate its supply chain, a “de-globalization” move that would significantly increase the unit cost of its most important upcoming product.

From a market expansion perspective, Tesla’s “FSD (Full Self-Driving) 12” European pilot program, which was slated for a wide release in late 2026, could become a political pawn. The EU has indicated it may use its “anti-coercion instrument” to block the certification of U.S. autonomous driving software. Given that Tesla’s long-term valuation—often cited by bulls as being driven by AI and Robotaxis—is predicated on global software-as-a-service (SaaS) revenue, a lockout from the European market would be a devastating blow to the growth narrative of TSLA stock.


The Boeing Company (BA): The Aerospace “Trench War” with Airbus

Perhaps the most direct casualty of a Greenland-related trade war is The Boeing Company (BA). The EU’s retaliation list of €93 billion explicitly targets “aircraft,” a move designed to provide a competitive windfall for Boeing’s arch-rival, the European-consortium Airbus. For Boeing (BA) stock, which is currently in the midst of a fragile recovery following years of production setbacks and safety scrutinies, a trade war is the ultimate “black swan” event.

Boeing’s 2026-2027 backlog includes hundreds of orders from European carriers like Lufthansa (Germany), Air France-KLM (France), and Ryanair (Ireland). These airlines, many of which receive state support or operate within the high-regulation environment of the EU, would face immense political and financial pressure to cancel Boeing orders in favor of Airbus if a 25% retaliatory tariff is applied to U.S.-made aircraft.

Analysis of BA stock must account for the company’s “2026 Turnaround Plan,” which relies on increasing 737 MAX production to 50 per month and stabilizing the 787 Dreamliner line. European suppliers provide critical components for these airframes—for instance, French-based Safran provides the LEAP-1B engines for the 737 MAX. If Trump’s 25% tariff makes these engines prohibitively expensive to import into the U.S., Boeing’s production costs will spiral, potentially forcing the company to seek further debt financing or government subsidies, further diluting the Boeing (BA) stock price.

Moreover, the “Golden Dome” defense system mentioned by Trump suggests an escalation in military spending. While Boeing is a major defense contractor, the potential for being “blacklisted” from European defense procurement—such as future fighter jet competitions or refueling tanker contracts in the UK and Germany—could offset any gains from increased U.S. domestic defense spending. For those tracking BA stock, the threat of a “closed” European aerospace market represents a long-term structural risk that far outweighs short-term geopolitical posturing.


Conclusion: Navigating a New Era of “Arctic Real Estate” Economics

The confrontation over Greenland marks a departure from traditional trade disputes. By linking sovereign territory acquisition to commercial tariffs, the U.S. administration has introduced a level of unpredictability that markets are struggling to price. The €93 billion retaliation from Europe is not merely a threat; it is a calculated strike at the heart of the U.S. tech and industrial sectors.

For Apple, the risk lies in the “digital curtain” falling across Europe. For Tesla, it is the fragmentation of a once-unified global manufacturing strategy. For Boeing, it is the potential loss of the world’s second-largest aviation market to a domestic competitor. As February 1 approaches, the AAPL stock, TSLA stock, and BA stock tickers will serve as the primary thermometers for this freezing of transatlantic relations.

Goldman Sachs at a Turning Point: A Deep Dive into GS Stock, Q4 2025 Financial Performance, Business Dynamics, and What Comes After the GS Financial Report

The Goldman Sachs Group, Inc. (NYSE: GS) delivered its fourth quarter and full year 2025 results on January 15, 2026, showcasing a performance that blends stronger-than-expected earnings with mixed revenue signals and strategic transitions still under way. In the context of broader market rhythms, Goldman Sachs’ earnings report encapsulates the complexities of Wall Street’s evolution — from classic trading and advisory engines to fee-based asset and wealth management, capital allocation decisions, and shifts in traditional consumer banking activities. The nuances inside the GS Financial Report — particularly the interplay of revenue drivers, expense dynamics, and strategic execution — are vital for understanding how the firm is positioned as we enter 2026.

In this expansive analysis of the Goldman Sachs Earnings, the objective is to concentrate on the core financial data, segment performance, causes behind notable shifts, implications for future growth and profitability, and how the market — reflected in the GS stock and GS stock price — is internalizing these developments.


Key Earnings Highlights: Revenue, EPS, and Full-Year Results

Goldman Sachs reported net revenues of $13.45 billion for Q4 2025 and net earnings of $4.62 billion — translating to diluted EPS of $14.01 for the quarter. For the full year, net revenues reached $58.28 billion, with $17.18 billion in annual net earnings and annual EPS of $51.32. Return on average common shareholders’ equity (ROE) for full year 2025 stood at 15.0%, while annualized ROE was 16.0% in the fourth quarter.

These figures collectively depict a firm that is continuing to generate comprehensive profits even amid a shifting revenue mix and competitive environment. The EPS beat analysts’ expectations — most notably in the fourth quarter where consensus estimates were materially lower — pointing to strong profitability performance.

Yet, revenue results were more nuanced; while Goldman Sachs exceeded expectations on earnings per share, total revenue slightly missed Street forecasts due in part to markdowns related to the Apple Card portfolio transition.


Understanding the Revenue Mix: What Drove Growth and What Didn’t

Investment Banking and Dealmaking

Investment banking fees rose sharply, a bright spot in the quarter. Fees in Q4 2025 climbed approximately 25% year-over-year, bolstered by increased activity across advisory, debt underwriting, and equity capital markets.

Why this matters: Deal activity is a bellwether for corporate confidence and capital-markets engagement. The rebound in mergers and acquisitions (M&A), alongside healthy underwriting markets, reflects a thawing after several quarters of muted strategic corporate transactions. CEOs and CFOs tending toward deal execution — whether strategic mergers, divestitures, IPOs, or debt financings — create a virtuous cycle of fee income for Goldman and its peers. This is particularly meaningful given the investment banking backlog rising for a seventh consecutive quarter — a strong indicator of near-term future revenue prospects.

Trading Revenue: Equities and FICC

Trading desks performed well overall, with equities net revenues climbing to $4.3 billion in the quarter — a testament to deep liquidity and client engagement in derivative and financing businesses. FICC (Fixed Income, Currencies, and Commodities) net revenues were also positive at $3.1 billion, up mid-teens year-over-year, driven by improved rates and commodities results.

Record performance in prime finance, notably strong derivatives results and high average balances, underscores the potency of Goldman’s trading position — particularly in institutional client flows. These segments are historically volatile and sensitive to macro swings, but Q4 showcased resilience.

Asset & Wealth Management Momentum

The asset and wealth management segment delivered another quarter of stable performance, with total assets under supervision (AUS) reaching a record $3.6 trillion. Long-term fee-based net inflows remained robust, reflecting persistent demand for diversified investment management services.

Private banking and lending revenues rose moderately — another example of steady expansion — while management fees continued to deepen the firm’s balance sheet beyond more cyclical trading and advisory streams.

Importantly, incentive fees for the quarter reached $181 million, bringing full-year incentive fees to $489 million — a 24% increase year-over-year — and laying groundwork toward a longer-term target of $1 billion.

Consumer Banking / Platform Solutions Transition

One of the headline drivers behind revenue pressures in the quarter was the transition — and eventual exit — of the Apple Card credit card portfolio to JPMorgan Chase. This transition led to a material markdown and related reserves adjustments, which negatively impacted reported revenue figures, despite releasing credit loss reserves that provided meaningful reserve relief.

While this discontinuity artificially depressed revenue in the short term, it clarifies Goldman’s strategic pivot away from scaled consumer banking toward more profitable, capital-efficient segments. The long-term strategic impact of this pivot remains a key theme for investors in the GS stock narrative.


Expense Dynamics, Operating Leverage, and Profitability

Even with strong top-line execution in advisory and trading, expense management remains a central theme. Operating expenses in the quarter climbed due to higher compensation costs, transaction-related costs, and technology spending — hallmarks of an investment bank scaling talent and capabilities to capture market opportunities.

Yet, the firm’s ability to generate a double-digit EPS beat amid these cost pressures suggests that operating leverage remains robust. Over time, as investment banking pipelines convert to revenue and capital markets cycles continue to favor liquidity and deal flow, the income statement should reflect proportionate benefit from these strategic investments.

Return on equity (ROE) of ~15% for 2025 and a quarter-annualized ROE of 16% in Q4 confirms significant profitability relative to capital deployed. This compares favorably with midsized banks but remains below some asset managers and diversified financial services peers — a reflection of the firm’s unique mix of cyclical revenue engines.


Strategic Shifts: What’s Changing at Goldman Sachs

Pivot Away from Consumer Banking

The Apple Card portfolio transition was more than an accounting event: it represents a philosophical shift away from lower-margin, deposit-reliant consumer banking businesses that historically strained Goldman’s capital allocation model. The revenue markdown tied to this exit may have been a short-term hit, but it simplifies the firm’s revenue profile and focuses capital on higher-return segments such as investment banking and asset management.

Deepening Fee-Based Revenue Engines

Goldman Sachs’ push to enhance long-term fee-based revenue — particularly within asset management and institutional wealth management — is crucial. Fee-based revenues tend to be more predictable and less correlated with trading volatility, smoothing earnings over economic cycles. The acceleration in long-term fee inflows and alternatives AUM (which accounted for significant inflows and now represents notable share of management fees) underscores this trend.

Trading Technology and Analytics Investments

Goldman Sachs is aggressively investing in technology to improve trading execution, analytics, and client service platforms — partly to sustain and expand its dominant position in equities and derivatives markets. Investments in digital infrastructure, machine learning tools, and risk analytics reflect an industry-wide shift toward hybrid human-machine decision-making frameworks, which Goldman intends to leverage in both institutional markets and asset-management contexts.


The Market Reaction: GS Stock and Stock Price Dynamics

In response to the earnings announcement, Goldman Sachs shares jumped sharply, with after-hours trading up around 4.6%, reflecting investor appreciation for the profit beat and dividend hike.

As of mid-January 2026, the GS stock price traded near ~$975.86, placing it near multi-year highs and buoyed by strong investor sentiment around investment banking strength and trading revenues.

Goldman Sachs’ valuation multiples and stock price performance need to be understood relative to both cyclicality and the firm’s strategic evolution: while the valuation remains high compared with traditional banks, measured against revenue diversification and fee-reliant business lines, it reflects a premium stance the market is willing to ascribe to a firm that can balance cyclical capital markets with stable wealth and asset management revenues.


Dissecting Trends and Long-Term Implications

Deal Activity and Investment Banking Outlook

The robust pickup in dealmaking — a long-anticipated renaissance after a traditionally slow period — is sharpened by an environment of lower interest rates, corporate reinvestment appetite, and reduced regulatory friction. This has significant implications:

  • Investment banking backlog expansion signals future revenue recognition beyond the current quarter, which supports near-term confidence in revenue continuity.
  • M&A and underwriting growth directly bolster fee income, a higher-margin component than net interest income or traditional trading. This mix enhances profitability ceilings.
  • Continued strength in these areas could drive inter-segment synergies — where advisory relationships feed asset and wealth management or financing solutions.

Trading and Market Volatility Exposure

Goldman’s trading revenues, particularly in equities and prime finance, benefit from market liquidity and client positioning activity. However, trading remains sensitive to volatility and macro conditions. A prolonged period of low volatility or subdued institutional flow could compress trading margins, making it essential for Goldman to balance this cyclicality with stable fee engines.

Fee-Based Revenue Growth and Asset Management Expansion

With AUS scaling to record levels and long-term fee inflows significant, Goldman Sachs is embedding itself deeper into client portfolios, which:

  • Reduces dependency on trading-centric revenues, particularly in adverse market conditions.
  • Offers scale advantages and recurring revenues, particularly in alternatives, private credit, and bespoke investment solutions.
  • Positions Goldman competitively alongside diversified financial institutions with strong wealth platforms.

Capital Allocation and Dividend Policy

The dividend increase to $4.50 per share underlines confidence in long-term cash flows and willingness to return capital to shareholders, a signal that comes with expectations of steady future performance.

Goldman’s capital strategy — balancing dividends, share repurchases, and reinvestment into growth areas — will be a critical lens for investors interpreting future GS stock price performance and valuation multiples.


Broader Industry and Macro Context

Goldman Sachs’ performance cannot be viewed in isolation. The macro backdrop — including global interest rates, regulatory frameworks, and economic growth expectations — all influence institutional client behavior, capital markets depths, and underwriting pipelines. Expectations for continued robust corporate earnings growth support broader equity markets, which in turn tend to favor institutional trading revenues and client engagement in portfolio transactions.

Geopolitical stability, regulatory clarity, and central bank policy trajectories will remain influential determinants of investment banking, lending, and trading revenue streams in 2026 and beyond.


Forward Outlook: Gauging Market Expectations

Looking beyond the report, several forward-looking themes stand out:

  • Deeper Fee Diversification: Goldman’s continued pivot into long-term fee revenue streams — including alternatives and advisory-linked recurring services — will serve as ballast against volatile trading cycles.
  • Capital Markets Momentum: If M&A and underwriting stay strong, the backlog and pipeline could turn 2026 into another banner year for investment banking revenue.
  • Conversion of Backlog into Revenue: The real test will be how effectively Goldman turns its expanded deal backlog into recognized revenue across advisory and underwriting segments.
  • Expense Discipline vs. Strategic Investment: As Goldman scales its technology platform and trading integration levers, managing compensation and non-compensation costs without suffocating growth will be key.
  • Dividends and Shareholder Returns: The dividend increase signals confidence, but future payout ratios and capital allocation choices will likely be watched closely by those tracking GS stock valuation and total returns.

Conclusion: A Pivotal Moment for Goldman Sachs and Its Stock

The January 15 release of the GS Financial Report for Q4 2025 and full-year 2025 delivered a compelling blend of profit beats, strategic transitions, and clear signals about the firm’s evolving revenue structure. Goldman Sachs Earnings reflect both the historical strength of its trading and investment banking franchises and the growing importance of fee-based asset management and advisory services. While revenue pressures tied to legacy consumer banking transitions added complexity, the concentrated focus on high-return segments — combined with expanded deal pipelines and robust performance in equities and FICC — positions Goldman to navigate the cycles ahead with resilience and optionality.

The GS stock price reaction captures investor appreciation for these dynamics, and the detailed financial data and forward-looking cues embedded in the earnings release continue to support a nuanced view of the firm’s trajectory.

By blending strong profitability metrics, disciplined capital management, renewed dealflow, and evolving service lines, Goldman Sachs appears set to continue its role as a central player in global finance — shaping not just its own future, but influencing broader narratives in capital markets and investment banking well into 2026 and beyond.