Nvidia has announced a new round of investment in Thinking Machines Lab, an artificial intelligence (AI) company founded by former OpenAI executive Mira Murati, and will provide the startup with chips to train and run its AI models.
Both companies stated in a press release on Tuesday that, under a multi-year agreement, Thinking Machines Lab will use Nvidia’s upcoming Vera Rubin AI acceleration chips. These chips are expected to be deployed early next year and will provide Thinking Machines Lab with at least 1 gigawatt of computing power (equivalent to the electricity consumption of approximately 750,000 households).
Nvidia had previously invested in Thinking Machines Lab last year. The specific terms of this investment were not disclosed, and it was not clarified whether the funding would be in cash, chips, or a combination of both. Nvidia referred to this as a “significant investment.” A spokesperson for Thinking Machines Lab declined to provide further details, and Nvidia has not yet responded to requests for comment.
As the world’s most valuable company, Nvidia has been involved in a series of investment deals in recent months. The chip giant is leveraging its resources to drive AI adoption across various industries and help fuel what it describes as a “new industrial revolution.” However, these investments have drawn attention due to the closed-loop nature of the model—Nvidia is investing in its own customers.
According to reports from November of last year, Thinking Machines Lab had been seeking a new round of funding, targeting a valuation of $50 billion. If achieved, this would represent a fourfold increase from its previous valuation of $12 billion in July, when the company completed a $2 billion financing round at that valuation.
Murati stated in a press release, “This partnership will accelerate our goal of building AI that users can truly shape and own, which will, in turn, unlock human potential.”
Murati, who previously served as OpenAI’s Chief Technology Officer, has led Thinking Machines Lab to recruit dozens of employees from OpenAI. The company launched its first product, Tinker, in October of last year. Tinker is designed to help users optimize large language models—this is the underlying technology behind chatbots like ChatGPT.
However, in recent months, Thinking Machines Lab has faced talent return, with several employees, including its CTO, rejoining OpenAI.
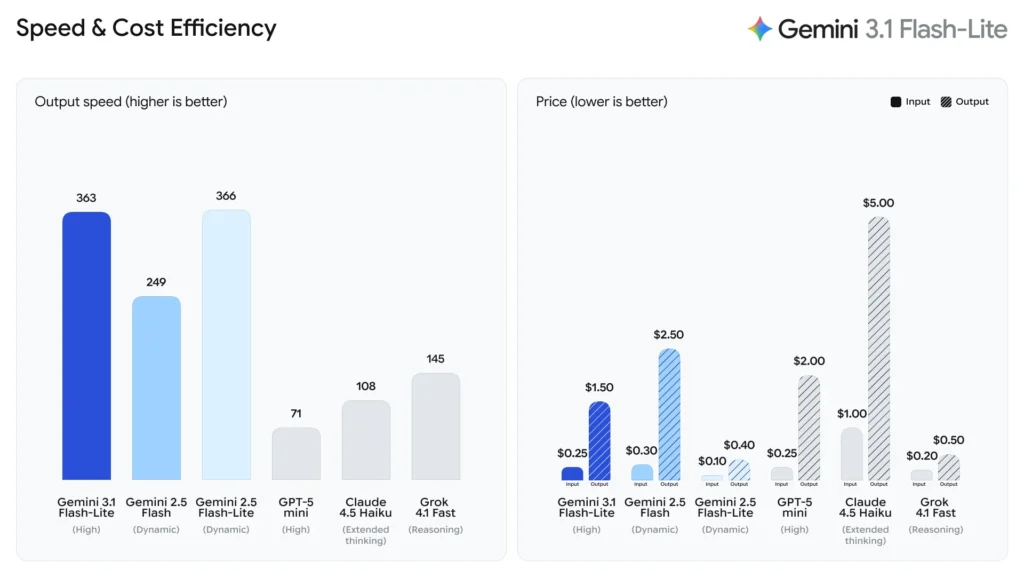
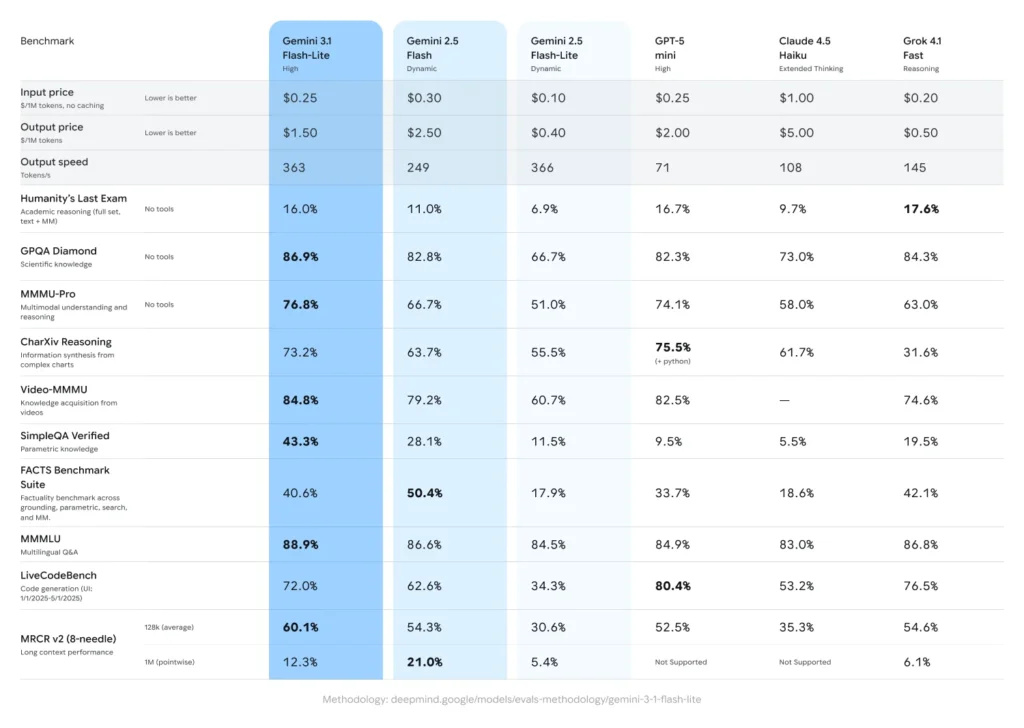
Gemini 3.1 Flash-Lite, designed for developers’ large-scale, high-frequency workloads, is now available for preview to developers starting Tuesday. It includes a “thinking level” feature and has shown significant improvements in performance benchmarks. The model’s first answer response time is 2.5 times faster compared to Gemini 2.5 Flash, and its output speed is 45% faster. In benchmark tests like GPQA Diamond and MMMU Pro, it outperforms competitors like GPT-5 Mini. The pricing is $0.25 per million input tokens and $1.50 per million output tokens, with a maximum context window of 1 million tokens.
On March 3rd, Google launched Gemini 3.1 Flash-Lite, the fastest and most cost-effective model in the Gemini 3 series. It is specifically designed for developers working with large-scale, high-frequency tasks, offering superior performance at a low cost.
The Gemini 3.1 Flash-Lite is available as a preview to developers starting on March 3rd and can be accessed through Google AI Studio’s Gemini API. Enterprise users can use it via Google Cloud’s Vertex AI platform. This model doesn’t require any specific hardware or software configuration, and users can simply call the API to integrate it.
According to benchmarks from Artificial Analysis, Gemini 3.1 Flash-Lite shows a 2.5x improvement in first-answer response time compared to Gemini 2.5 Flash and a 45% increase in output speed, all while maintaining similar or better quality.
Google revealed that the model achieved an Elo score of 1432 on the Arena.ai leaderboard, surpassing other models in multiple reasoning and multimodal understanding benchmark tests. It even outperformed the larger Gemini 2.5 Flash in certain tests, meaning users can achieve better performance without paying for flagship models. Early adopters such as Latitude, Cartwheel, and Whering have already tested the model and reported notable efficiency and cost advantages.
Positioning and Pricing: The Go-To Choice for High-Frequency Scenarios
Google DeepMind describes 3.1 Flash-Lite as a “cost-effective, fast model optimized for high-frequency, latency-sensitive tasks (such as translation and content classification).” It is the newest member of the Gemini 3 series, a family of native multimodal reasoning models.
In terms of pricing, 3.1 Flash-Lite is priced at $0.25 per million input tokens and $1.50 per million output tokens. Google emphasizes that this pricing is only a small fraction of what larger models would cost, making it ideal for developers and enterprises that require large-scale deployment while being highly cost-sensitive.
The model supports multimodal inputs, including text, images, audio, and video, with a maximum context window of 1 million tokens and an output limit of 64,000 tokens, catering to a wide range of tasks, from document summarization to complex multimodal operations.
Performance Benchmarks: Outperforming Peers and Challenging the Flagship
In terms of core performance metrics, Google cited Artificial Analysis benchmark data showing that 3.1 Flash-Lite’s first-answer response time (Time to First Answer Token) is 2.5 times faster than Gemini 2.5 Flash, with a 45% increase in output speed.
In terms of intelligence assessments, the model scored 86.9% in the GPQA Diamond test and 76.8% in the MMMU Pro test, surpassing competitor models at similar levels. Notably, Google pointed out that 3.1 Flash-Lite even outperformed the larger Gemini 2.5 Flash in certain benchmark tests, meaning users can achieve superior performance without the cost of flagship models.
Key Features: Adjustable “Thinking Levels”
In addition to speed and cost, a unique feature of 3.1 Flash-Lite is the “thinking levels” control, available within AI Studio and Vertex AI. This allows developers to adjust the model’s reasoning depth based on task complexity.
Google stated that this feature is “crucial for managing high-frequency workloads.” For batch tasks like translation or content moderation, developers can opt for a lower thinking level to reduce costs. For tasks requiring deep reasoning, such as generating user interfaces, creating simulated scenarios, or following complex instructions, the thinking level can be increased to improve output quality.
On the architecture front, Google DeepMind disclosed that 3.1 Flash-Lite is built on Gemini 3 Pro, trained using Google’s custom Tensor Processing Units (TPUs) and the JAX and ML Pathways software frameworks.
Enterprise Feedback: Highly Praised for Efficiency and Instruction Following
Several early-testing companies have provided positive feedback on 3.1 Flash-Lite, especially regarding its speed, instruction-following ability, and scalability.
Kolby Nottingham, AI head at the narrative platform Latitude, noted, “Google’s model stands out in its instruction-following ability and speed compared to other products. Its success rate is 20% higher than the models we previously used, and its inference speed is 60% faster, enabling Latitude to deliver complex narrative experiences to a broader audience.”
Andrew Carr, chief scientist at AI animation tool Cartwheel, described the model as “unbeatable in intelligence and speed,” adding, “It excels at tool invocation and can explore code libraries quickly in a fraction of the time larger models would require. With many multimodal annotation use cases, Flash-Lite has become a key unlock tool for processing more data and gaining deeper insights.”
Bianca Rangecroft, CEO of fashion app Whering, shared that integrating 3.1 Flash-Lite into their classification process has resulted in “100% consistency in product tagging,” even with complex fashion categories, providing “definitive and repeatable results.”
Kaan Ortabas, co-founder of enterprise AI platform HubX, provided specific data: “As a core orchestration and content engine, Gemini 3.1 Flash-Lite consistently delivers completion times under 10 seconds, near-real-time streaming output, approximately 97% structured output compliance, and 94% intent routing accuracy, achieving an excellent balance between speed, instruction precision, and cost-effectiveness.”