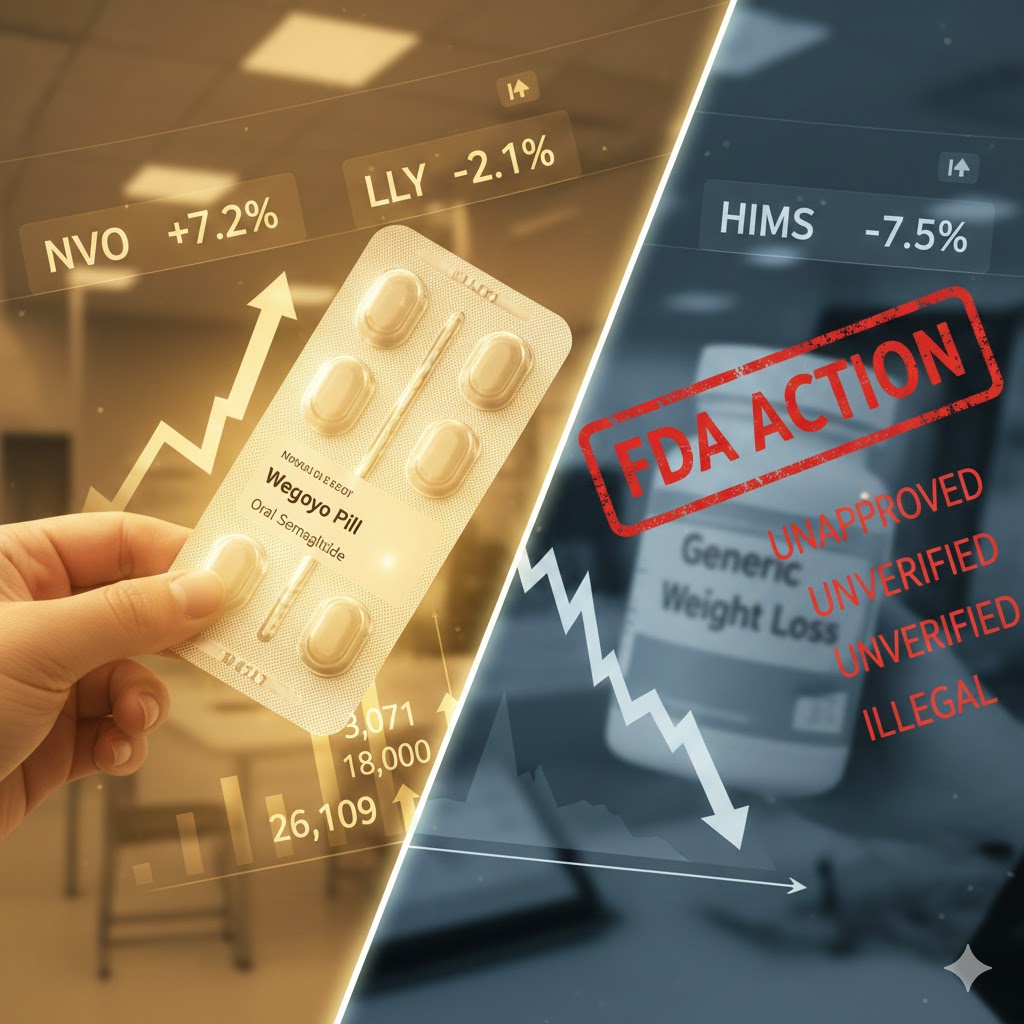
Novo Nordisk(NVO)’s stock continues to rebound, as telemedicine company Hims & Hers Health has withdrawn its plan to launch a low-cost generic weight loss drug under pressure from regulators and legal threats. This news has significantly eased market concerns over the potential impact of cheap generic alternatives on Novo Nordisk’s core products, strengthening its competitive edge in the GLP-1 drug market.
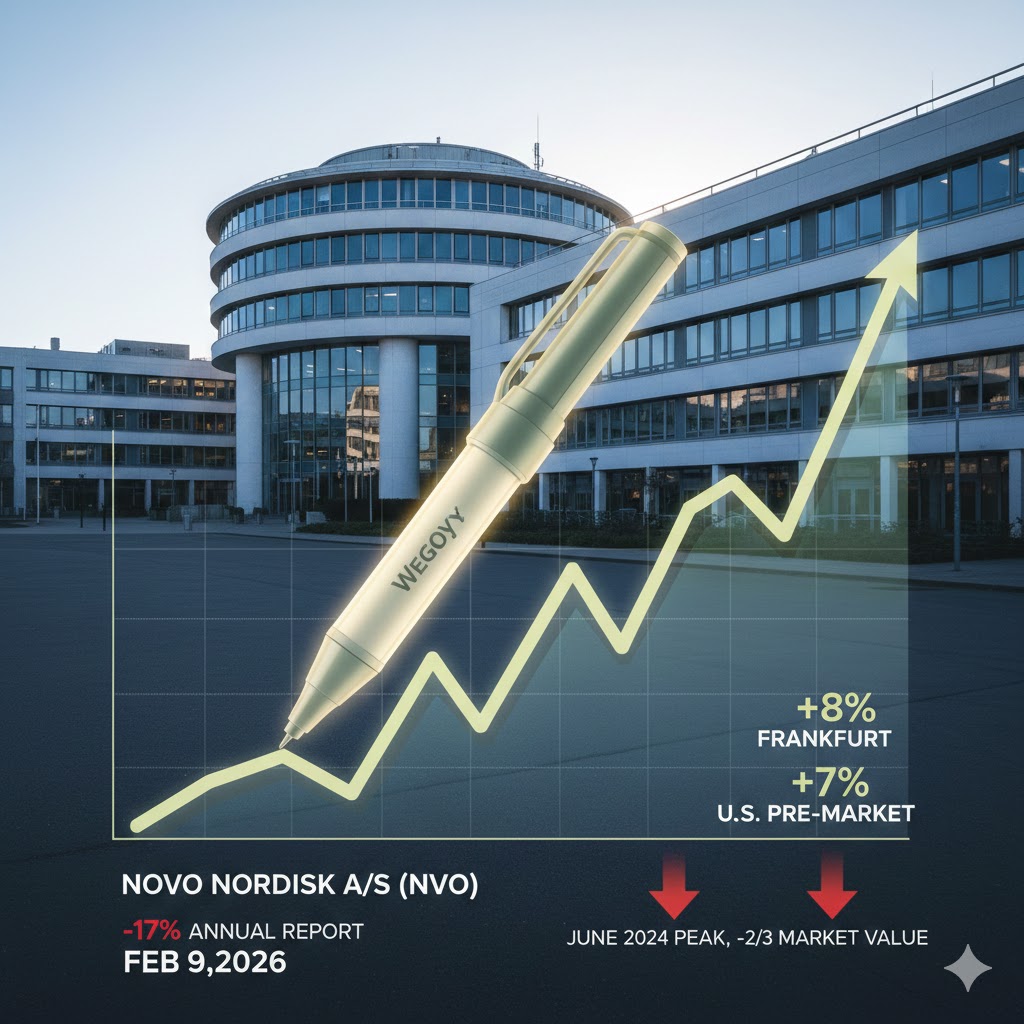
On Monday, Novo Nordisk’s stock rose more than 8% on the Frankfurt stock exchange, extending the rebound from last Friday. In pre-market trading in the U.S., the stock surged over 7%. Previously, Hims & Hers had attempted to launch a composite weight loss drug based on semaglutide at a price of only $49. However, after facing legal threats from Novo Nordisk and the U.S. Food and Drug Administration (FDA), the company announced on Saturday that it would halt the offering of this treatment.
Hims & Hers stated that after engaging in “constructive dialogue” with stakeholders, it had decided to withdraw the product. This incident signals that regulatory authorities are tightening their stance on unauthorized composite GLP-1 drugs. Last Friday, FDA Director Marty Makary signaled that the agency would clamp down on such drugs, which helped propel Novo Nordisk’s stock to a 5% rebound that day.
Although the stock saw a significant short-term increase, Novo Nordisk still faces fierce competition from Eli Lilly and ongoing challenges from cheaper composite alternatives in the market. In its annual earnings report last week, the company warned of facing “unprecedented price pressures,” leading to a 17% drop in its stock. Since its market peak in June 2024, the company’s market value has shrunk by nearly two-thirds.
Tightening Regulations and Competitor Withdrawal
The composite weight loss drug Hims & Hers sought to introduce was based on semaglutide, the key ingredient in Novo Nordisk’s blockbuster drugs Wegovy and Ozempic. As soon as the product was announced, it faced strong opposition from the Danish pharmaceutical giant and regulatory authorities.
According to Reuters, after receiving legal and regulatory threats from Novo Nordisk and the FDA, Hims & Hers quickly changed its position over the past weekend. The company announced on Saturday that it would cease offering the treatment. This retraction directly contributed to Novo Nordisk’s stock price increase on the Frankfurt exchange on Monday.
Before this, FDA Director Marty Makary’s remarks on cracking down on unauthorized composite GLP-1 drugs had already injected confidence into the market. These composite drugs have long been seen as the primary threat to Novo Nordisk’s pricing power in the weight loss and diabetes markets. As a result of this regulatory shift, Novo Nordisk’s stock had already rebounded by over 5% last Friday.
Ongoing Price War Pressure
Despite the temporary alleviation of specific low-cost generic drug threats due to regulatory intervention, Novo Nordisk’s market environment remains challenging. In addition to facing competitors like Hims & Hers, which are attempting to enter the market with composite drugs, the company must also contend with strong competition from major rival Eli Lilly.
In its annual earnings report released last week, Novo Nordisk warned investors that it was facing “unprecedented price pressures.” This pessimistic outlook triggered panic among investors, causing the stock to plummet by 17% after the report was released. The market is generally concerned that, as more competitors enter and alternative therapies emerge, the once high-margin weight loss drug market will be caught in a brutal price war.
Significant Market Value Erosion
These market fluctuations highlight the fragile valuation of Novo Nordisk. Once a market darling, the company’s market value peaked in June 2024. However, due to increasing competition and pricing pressures, its stock has significantly declined since then, with nearly two-thirds of its market value evaporating.
While the withdrawal of a competitor’s generic drug project has temporarily boosted the stock price, whether it can reverse the long-term downtrend remains to be seen. The company’s ability to maintain its product competitiveness and pricing power in an increasingly crowded market will determine its future trajectory.