Amgen(AMGN) Surges Over 8% After Beating Q4 Expectations, Launches Phase 3 Trials for Type 2 Diabetes Drug
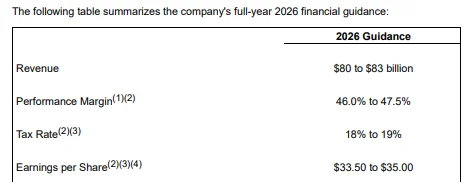
Amgen reported a 9% year-over-year increase in Q4 revenue to $9.87 billion, surpassing analysts’ average estimate of $9.47 billion. Net profit soared more than 112% to $1.33 billion, with adjusted earnings per share reaching $5.29, well above the forecasted $4.73. Looking ahead, Amgen expects its 2026 revenue to be between $37 billion and $38.4 billion, with adjusted earnings per share ranging from $21.6 to $23, compared to analysts’ estimates of $37.19 billion and $20.63 per share.
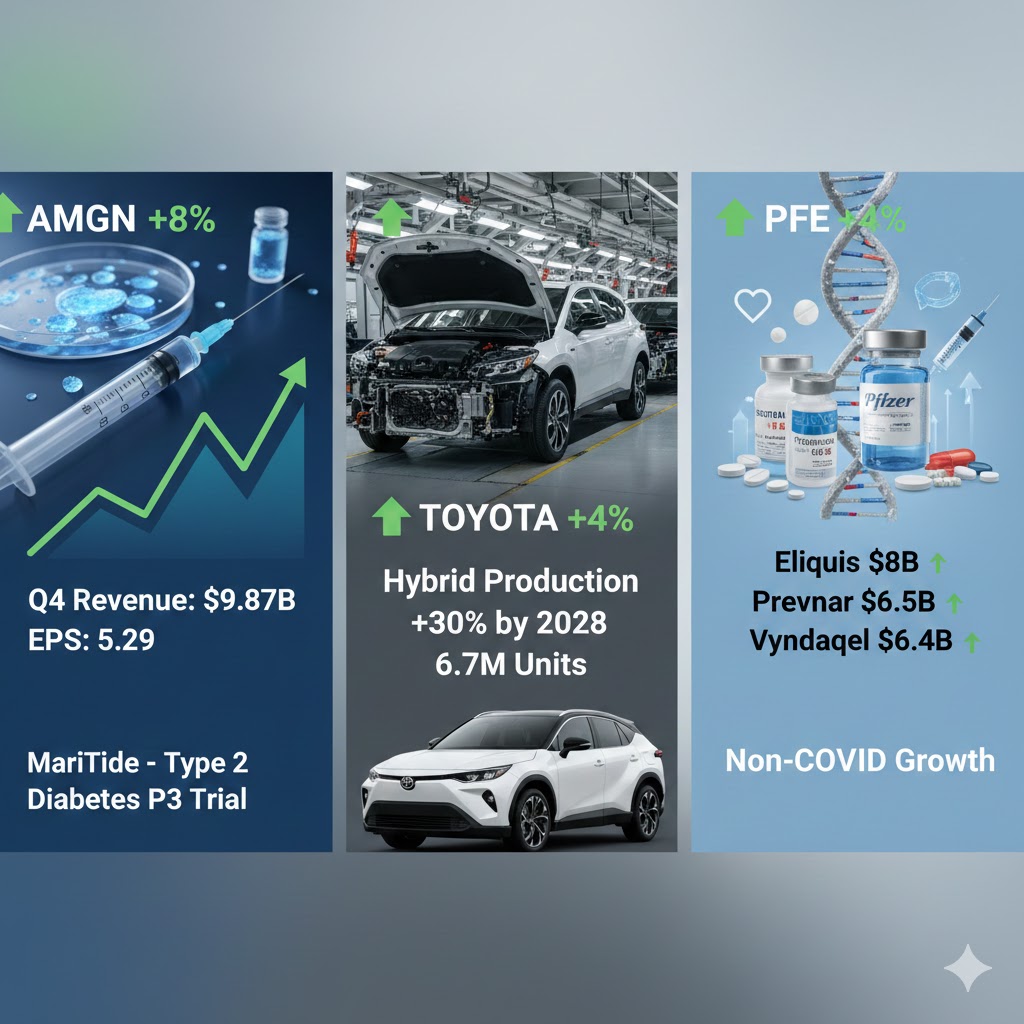
Additionally, Amgen is conducting six Phase 3 trials for its experimental drug MariTide, targeting obesity and related diseases such as heart disease and sleep apnea. The company also plans to initiate a Phase 3 clinical trial for Type 2 diabetes patients later this year.
Toyota(TM) to Increase Hybrid Production by 30% by 2028, Shares Up Over 4%
Toyota plans to increase its production of hybrid and plug-in hybrid vehicles to approximately 6.7 million units by 2028, a 30% increase from its estimated 2026 production target of about 5 million units.
In terms of overall production, Toyota expects its global car output to reach around 11.3 million vehicles by 2028, a 10% increase from its 2026 forecast. This means that hybrid vehicles will account for nearly 60% of the company’s total production, becoming the core driver of its growth in both production and sales. Analysts suggest that this large-scale production expansion not only addresses increasingly stringent carbon emissions regulations but also seeks the best profit balance in the EV competition by leveraging its well-established technology moat.
Currently, Toyota has begun in-depth discussions with major suppliers to ensure that its supply chain for critical components and raw materials can keep pace with the planned production expansion. The company emphasized that these numbers are for reference only and are not part of its official production or sales plans.
Pfizer(PFE) Jumps Nearly 4% as Non-COVID Products Show Strong Growth
In its full-year 2025 performance, Pfizer’s non-COVID product portfolio demonstrated strong structural growth. Despite a significant drop in COVID-related revenues, the company successfully shifted its focus toward innovative treatments by continuously optimizing its product mix and increasing market share.
Cardiovascular and vaccine segments led the way in growth. The anticoagulant drug Eliquis generated $8 billion in revenue for the year, an 8% increase, solidifying its position as the company’s second-largest product. The growth was mainly driven by improved Medicare payment conditions in the U.S. and steady global demand.
The Prevnar vaccine series achieved $6.5 billion in revenue, a 1% increase, with particularly strong performance in international markets for adult indications. The heart disease treatment Vyndaqel family was a key performer, with revenues rising by 17% to $6.4 billion, primarily driven by increased diagnosis rates and improved payment conditions in the U.S. Despite facing some pressure from Medicare pricing in Q4, Vyndaqel still generated $1.7 billion in revenue for the quarter, a 9% year-over-year increase, maintaining strong growth momentum.