The Urban Value Surge: Deconstructing Citi Trends’ Q3 2025 Performance and the Roadmap to $227 Million Growth

In the highly fragmented landscape of value-based apparel retail, few names carry as much cultural weight in urban communities as Citi Trends, Inc. (NASDAQ: CTRN). On December 2, 2025, the company released its Citi Trends Financial Report for the third quarter of fiscal year 2025, a document that served as a defining proof point for the brand’s multi-year “Repair, Execute, and Optimize” strategic framework. Amidst a broader retail environment characterized by cautious discretionary spending, the Q3 results provided a vivid snapshot of a retailer that is successfully leaning into its niche. For investors tracking CTRN stock, the quarter was marked by a significant revenue “beat” that sent the stock surging in pre-market trading, yet it also revealed the complexities of a business still fine-tuning its profitability engine.

The Statistical Pivot: Analyzing the $197 Million Revenue Breakthrough

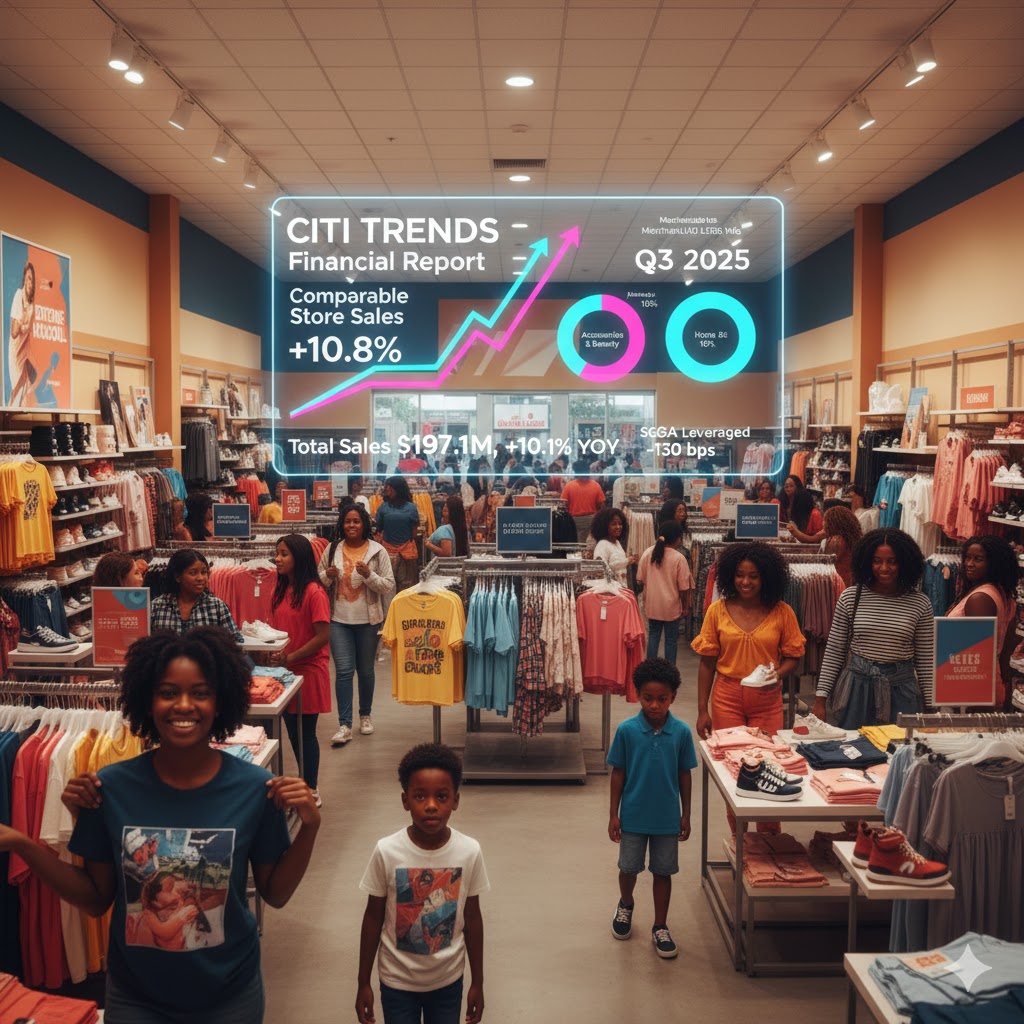
The data presented in the Citi Trends Earnings call for the period ended November 1, 2025, was defined by an impressive top-line acceleration. The company reported total sales of $197.1 million, a 10.1% increase compared to the $179.1 million recorded in the third quarter of 2024. This figure not only surpassed the company’s internal targets but also beat the analyst consensus of $187.3 million by a wide margin. To appreciate the magnitude of this growth, one must look at the comparable store sales (comp sales), which grew by 10.8%—marking the fifth consecutive quarter of positive comp performance.

This revenue surge was driven by a triad of operational improvements: increased foot traffic, larger average basket sizes, and higher conversion rates. Management attributed this “trifecta” of success to a refined three-tiered merchandise assortment strategy. By balancing high-trend fashion, opportunistic off-price deals, and “extreme value” branded products, Citi Trends has successfully captured a larger share of the wallet from its core demographic—African American families living in urban and secondary markets. The back-to-school season was particularly robust, with the Children’s and Men’s divisions leading the charge.

On the profitability front, however, the results were more nuanced. The company reported a net loss of $6.9 million, or a basic loss per share of $0.86. While this was a slight improvement over the $7.2 million loss in the prior year, it missed the consensus estimate of a $0.79 loss per share. The discrepancy between the revenue beat and the EPS miss was primarily due to a 90-basis-point contraction in gross margin, which landed at 38.9%. This decline was largely a result of the “pull-forward” of freight expenses from the fourth quarter—a strategic move to balance the workload at distribution centers ahead of the high-stakes holiday season.

The Efficiency Engine: SG&A Leverage and the $82 Million Projection

A critical component of the Citi Trends Financial Report was the company’s ability to achieve operating leverage even while growing its cost base. Selling, General, and Administrative (SG&A) expenses for the quarter were $79.3 million, up from $74.7 million in the previous year. However, on a rate basis, adjusted SG&A expenses leveraged by 130 basis points. This means that for every dollar of revenue generated, Citi Trends is becoming more efficient at managing its overhead.

The increase in absolute SG&A spend was largely due to two factors: the costs associated with processing a significantly higher volume of sales and $3.2 million in incremental incentive compensation—a direct result of the company’s improved financial trajectory. For investors in CTRN stock, this is a “good” type of expense growth, as it indicates that the company is rewarding its leadership team for meeting aggressive performance targets.

Looking ahead to the fourth quarter, management has projected SG&A expenses to be approximately $82 million. This increase reflects the peak hiring and marketing spend associated with the holiday season. The goal for 2026 is to continue this leveraging trend, with a target of 60 to 90 basis points of annual SG&A improvement as the company approaches its goal of mid-to-high single-digit operating margins.

Strategic Real Estate: Remodels and the “Store of the Future”

A major pillar of the Citi Trends Earnings story is the aggressive modernization of its physical footprint. During the third quarter, the company remodeled 24 stores and opened 3 new locations, ending the period with a total of 593 stores. These remodels are not merely cosmetic; they are designed to optimize the flow of traffic and highlight the “extreme value” and “branded” categories that are currently driving the highest margins.

The data suggests that remodeled stores are consistently outperforming the rest of the chain in terms of sales density and customer satisfaction scores. For fiscal year 2025, the company is on track to remodel a total of 60 stores. This “store-within-a-store” strategy—where specific zones are dedicated to accessories, beauty, and home lifestyle—has allowed Citi Trends to diversify its revenue streams. In Q3, Accessories & Beauty accounted for 15% of total sales, while Home & Lifestyle reached 10%. By reducing the reliance on pure apparel, Citi Trends is building a more resilient, year-round business model.

Inventory management also remained a bright spot. Merchandise inventory at the end of the quarter was $123.5 million, a 3.1% decrease compared to Q3 2024. Despite the lower overall inventory levels, average store inventory was actually up 4.5%, reflecting a faster supply chain and a more strategic “in-season” buying approach. This improved inventory turnover is a key driver of the 230-basis-point gross margin expansion forecast for the full year 2025.

Financial Health: The $51 Million Cash Fortress

One of the most compelling aspects for anyone analyzing CTRN stock is the company’s pristine balance sheet. Citi Trends ended the third quarter with $51.1 million in cash and cash equivalents, and notably, zero debt. The company has a $75 million credit facility that remains entirely untapped. In an era where high interest rates have crippled many small-cap retailers with heavy debt loads, Citi Trends’ “debt-free” status provides it with an enormous competitive advantage and significant strategic flexibility.

This liquidity allowed the company to raise its full-year EBITDA guidance to a range of $10 million to $12 million. This represents a staggering $21 million to $25 million improvement compared to the full year 2024. For a company with a market capitalization of approximately $400 million, this swing in EBITDA is a powerful indicator of the “turnaround” narrative taking hold.

Outlook and CTRN Stock Price Prospective

As of January 12, 2026, the CTRN stock price is trading at approximately $48.43 on the NASDAQ. The stock has been on a remarkable tear over the past few months, rising from a 52-week low of $16.82 to its current levels, which are near its 52-week high of $49.50. The market’s reaction to the December 2nd report was overwhelmingly positive; while the EPS was a slight miss, the 10.8% comp sales growth and the raised full-year guidance were seen as clear evidence that the company is winning market share.

From a valuation perspective, CTRN stock is currently trading at a Price-to-Sales (P/S) ratio of approximately 0.49x. While this is a step up from the distressed levels of 2024, it still represents a significant discount compared to other off-price retailers like TJX Companies or Ross Stores, which often trade at P/S ratios of 1.5x to 2.0x. This “valuation gap” suggests that if Citi Trends can demonstrate a consistent return to GAAP profitability in 2026, there is still substantial room for the stock to re-rate higher.

Technically, the stock is in a confirmed bull market. It is trading well above its 50-day and 200-day moving averages. The immediate resistance level is at the $50.00 psychological mark. A break above $50.00 could open the door for a move toward the $60.00 range, especially if the Q4 holiday results—which the company will report in March—show continued comp sales momentum. However, investors should remain mindful of the “choppy” nature of profitability; the stock has a high beta and can be sensitive to broader economic data regarding consumer credit and employment in urban centers.

Conclusion: The Polished Urban Powerhouse

The December 2nd Citi Trends Financial Report marks a turning point for the Savannah-based retailer. By focusing on its core multicultural customer base and executing a disciplined real estate and merchandise strategy, Citi Trends has transformed from a struggling survivor into a high-growth urban powerhouse. While the road to absolute GAAP profitability still has some hurdles—particularly regarding margin stabilization—the underlying trajectory of the business is undeniably positive.

For investors, CTRN stock represents a high-conviction play on the resilience of the value-conscious consumer. With a debt-free balance sheet, a $10 million+ EBITDA run rate, and a “store of the future” that is clearly resonating with shoppers, Citi Trends is well-positioned to continue its ascent in 2026. The “urban value surge” is no longer just a headline; it is a fundamental reality for this uniquely positioned retailer.

Filtration in Focus: A Strategic and Financial Dissection of Donaldson’s December 4 Earnings and Its Implications for DCI Stock

On December 4, 2025, Donaldson Company, Inc. (NYSE: DCI) — a global leader in filtration systems and industrial solutions — reported its first quarter fiscal year 2026 earnings, unveiling a performance that blended modest revenue gains with stronger profitability and upward guidance. The DCI Financial Report revealed continued resilience in core demand, the impact of strategic pricing and cost optimization actions, and management’s confidence in doubling down on growth drivers. For market observers and investors tracking DCI stock, these quarterly results offered both detailed quantitative data and important qualitative insights regarding competitive positioning, product strategy, segment developments, and the broader macroeconomic backdrop shaping demand for filtration products across industries.

In a year marked by macroeconomic headwinds, supply chain evolution, and shifting industrial demand patterns, Donaldson’s December earnings release provided a critical checkpoint on how the company — with its diversified filtration portfolio — is navigating these forces. This report examines Donaldson Company Earnings from the ground up: highlighting financial results, teasing out underlying operational trends, linking data changes to causative factors, analyzing future business impacts, and situating these within broader market and strategic narratives.


I. Summary of the DCI Financial Report: Key Takeaways from December 4, 2025

The earnings release reported on December 4, 2025 detailed Donaldson’s performance for the first quarter of fiscal year 2026, which ended October 31, 2025. Below are the most salient metrics:

Revenue and Earnings

  • Net sales: $935.4 million, up approximately 3.9% year‑over‑year, exceeding consensus estimates and marking a continuing top‑line growth trajectory for DCI.
  • GAAP net earnings: $113.9 million, up from $99.0 million year‑ago, reflecting improved profitability and operational leverage.
  • Diluted EPS: $0.97, a 19% increase compared with the prior year’s $0.81.
  • Adjusted EPS (non‑GAAP): $0.94, an increase of roughly 13.3% over the prior year’s adjusted base.
  • Operating margin: expanded to a record 15.5%, illustrating improved cost efficiency and scale benefits.
  • Revenue beats: Actual figures outpaced both consensus revenue and EPS expectations.

Guidance Upgrades & Forward Expectations

  • Fiscal 2026 sales guidance: projected around $3.8 billion, with expected 1%–5% growth — indicating a continuation of steady expansion.
  • Adjusted EPS guidance: tightened upward to $3.95–$4.11 for the full year, illustrating confidence in earnings conversion.
  • Operating margin guidance: expected to increase further on the back of efficiency initiatives.

This mix of record margins, revenue growth above forecast, and raised guidance underpins a meaningful narrative of disciplined execution across Donaldson’s core businesses, and sets an important backdrop for assessing the near‑term trajectory of Donaldson Company stock.


II. How Donaldson Defines Its Business — Portfolio, Strategy, Market Footprint

Donaldson Company, Inc. stands as a global filtration leader that produces and sells engineered filtration products designed to reduce emissions, protect equipment, and improve air and fluid quality across industrial and mobile applications. Its solutions span mobile solutions, industrial solutions, and increasingly Life Sciences and advanced technology markets.

At a high level, the company’s business architecture is rooted in:

  • Mobile Solutions: Filtration products for on‑road and off‑road engines, including aftermarket filters and OEM systems. Market segments include construction, agriculture, mining, transportation, and related sectors where engine longevity and emission control are mission critical.
  • Industrial Solutions: Designed for heavy industrial applications, including compressed air systems, dust and fume collectors, gas turbine intake systems, and specialized liquid filtration.
  • Life Sciences and Advanced Markets: Filtration systems targeting food & beverage, pharmaceutical bioprocessing, medical devices, and high‑purity semiconductor manufacturing — areas showing higher growth potential and technological complexity.

Donaldson’s diversified portfolio and global footprint — with production and sales networks spanning more than 40 countries — positions the company to balance demand cycles across regions, end markets, and economic environments.

This diversification explains why Donaldson Company Earnings are often described in segment performance terms rather than single product lines. It also helps contextualize how macroeconomic shifts — such as construction activity, industrial machinery demand, and life sciences capital spending — influence revenue dynamics.


III. Detailed Financial Performance Analysis

A. Revenue Growth Drivers and Segment Contributions

A 3.9% year‑over‑year revenue increase in Q1 FY2026, reaching $935.4 million, may appear moderate on its face, but it reflects positive momentum in several high‑value areas of Donaldson’s business.

Mobile Solutions Expansion:
Mobile Solutions delivered solid performance, with replacement parts and aftermarket sales rising meaningfully. This dynamic is critical: while new equipment sales tend to fluctuate with broader industrial cycles, aftermarket replacement part demand — including filters that must be regularly serviced or replaced — provides a recurring revenue anchor and tends to be less cyclical. The expansion of replacement parts sales contributed materially to the overall revenue increase.

Segment revenue growth was particularly strong in:

  • Off‑Road markets: Benefiting from construction and agricultural equipment activity, a segment where filtration reliability directly correlates to machine uptime and operating cost reductions.
  • Aftermarket channels: Gaining share through expanded distribution networks and strategic partnerships, driving higher parts sales volume.

However, the On‑Road segment saw relative softness in the quarter owing to cyclical fluctuations in commercial truck production and broader transportation markets, which in some cases depressed demand in that sub‑segment. The offsetting strength in aftermarket parts and diversification across geography and product lines illustrates the company’s strategic advantage in balancing cyclical fluctuations.

Industrial Solutions:
Industrial Solutions overall was roughly flat year‑over‑year in revenue when accounting for mixed growth in components like industrial filtration versus aerospace and defense systems. This indicates stable base demand but ongoing variability tied to project timing and industrial capex cycles.

Industrial sales — including dust, mist, and gas filtration — often depend on broader manufacturing demand, energy infrastructure projects, and capital equipment spending. As markets such as semiconductor fabrication and aerospace continue to require higher‑purity filtration systems, this segment’s underlying dynamics have potential for accelerated long‑term growth even if Q1 performance was stable rather than spectacular.

Life Sciences and Advanced Technology:
While this segment remains smaller relative to Mobile and Industrial Solutions, it showed notable growth and stands out as a key strategic contributor. The company has noted strength in Food & Beverage and disk drive sectors, signaling the filtration portfolio’s adaptability to high‑precision industrial applications. Filtration in the life sciences arena often commands premium pricing and deeper technical integration, which can enhance margins and foster customer stickiness.

Collectively, this segmentation underscores multi‑vector growth drivers for Donaldson, where replacement parts, industrial growth, and technology‑intensive applications converge to support revenue expansion.


B. Profitability and Margin Trends

One of the most striking developments from the December 4 DCI Financial Report was the expansion of operating margin, which reached a near‑record 15.5% for the quarter. This improvement was underpinned by operational efficiencies, cost optimization initiatives, and operating leverage tied to higher sales volumes.

Gross Margin Dynamics:
Gross margin levels held up well despite inflationary pressures on raw materials and component costs — a testament to pricing power in certain filtration product categories and disciplined cost absorption strategies. Donaldson’s ability to translate pricing benefits and operational gains into higher margins suggests that the company’s cost structure is increasingly flexible and adaptable to evolving input cost environments.

Operating Expense Control:
Management’s focus on footprint optimization, expense management, and streamlined operations appeared to deliver tangible results, with a higher operating margin despite modest revenue growth. As margins expanded ahead of prior forecast ranges, this contributed to more favorable earnings outcomes even with mid‑single‑digit sales growth.

Adjusted EPS Growth vs. GAAP Results:
The company reported adjusted EPS up 13.3% and GAAP EPS up 19% year‑over‑year, signaling strong bottom‑line leverage. The difference between adjusted and GAAP metrics stems from non‑recurring items such as gains on asset sales and restructuring charges, which management adjusts for to highlight core operational profitability.

Rising operating margins despite revenue growth being modest reflects effective cost discipline and pricing execution, both of which are critical metrics for understanding Donaldson’s long‑term profitability trajectory and a key element in interpreting the DCI Financial Report.


C. Cash Flow, Capital Allocation, and Shareholder Returns

Donaldson’s cash flow and capital allocation choices further bolster the financial health narrative emerging from the Q1 report. In the preceding fiscal year, the company executed a significant share repurchase program — repurchasing millions of shares to create shareholder value and manage dilution — while also maintaining a steady quarterly dividend.

Although specific cash flow figures for Q1 were not highlighted in the earnings release, ancillary reports indicate that management returned approximately $127 million to shareholders in repurchases and dividends during the period, reflecting a balanced approach to capital deployment.

In addition to shareholder returns, investment in capital expenditures (CapEx) remains disciplined, with planned spending of $65–$85 million for fiscal 2026 largely directed toward capacity expansion, productivity enhancements, and technology upgrades — areas key to sustaining competitive advantages.

This capital allocation strategy — balancing share buybacks, dividends, and strategic reinvestment — supports earnings per share growth while maintaining operational flexibility.


IV. Strategic Trends and Business Development

Financial data is only one side of the story. To understand how the DCI stock price might respond in future periods, it’s critical to examine strategic trends, product and market development, and management’s long‑term vision.

A. Razor‑to‑Sell‑Razorblades Model and Aftermarket Focus

One of the key strategic models Donaldson emphasizes is the razor‑to‑sell‑razorblades approach, wherein the company sells durable filtration systems (“razors”) and generates continuous aftermarket parts revenue (“blades”) through replacements, upgrades, and servicing.

This strategy provides several advantages:

  • Recurring revenue: Aftermarket replacement parts generate predictable and high‑margin revenue streams that are less volatile than new equipment sales.
  • Customer stickiness: Customers with installed bases of Donaldson systems are more likely to continue purchasing consumables, which fosters long‑term relationships and predictable lifetime value.
  • Technology leverage: As engine technologies change — including emissions systems and advanced filtration materials — Donaldson’s extensive R&D ensures that new replacement filters deliver performance improvements that maintain customer willingness to upgrade.

B. Market and Geographic Diversification

Donaldson’s global footprint — with manufacturing, distribution, and R&D presence in more than 40 countries — mitigates localized economic cycles and geopolitical risks.

Revenue coming from diverse end markets — agriculture, construction, transportation, aerospace, industrial manufacturing, and high‑purity filtration — reduces dependency on any single sector. This diversification is visible in the company’s various business lines outperforming at different points in economic cycles.

For example, while on‑road truck filtration demand fluctuates with macro transport spending cycles, aftermarket heavy equipment parts remain steady. In industrial solutions, sectors like semiconductor, disk drive, and food & beverage filtration systems have their own growth dynamics, sometimes independent of broader manufacturing capex cycles.

This broad market reach helps protect Donaldson against revenue concentration risk and supports organic growth across segments.


C. Technology, Innovation, and Life Sciences Growth

Increasing emphasis on high‑tech filtration solutions — including life sciences and advanced industrial applications — is a strategic priority area.

This includes:

  • Medical and bioprocessing filtration systems, where precision and regulatory compliance offer premium pricing and long contract durations.
  • Semiconductor‑focused filtration technologies, in markets where advanced purity standards are essential and demand is influenced by secular trends such as AI data center buildouts and next‑generation computing components.
  • Environmental and sustainability filters, where air quality, emissions reduction, and regulatory standards are tightening globally.

These higher‑growth, higher‑margin opportunities diversify Donaldson’s revenue base beyond traditional heavy equipment and industrial filtration, and position the company for secular demand tailwinds.


V. Competitive Context and Industry Dynamics

Though Donaldson’s historical brand strength and technical expertise give it a competitive advantage, it operates in a landscape where:

  • OEMs and aftermarket players exert pricing pressure, particularly in regions with lower production costs.
  • Macro industrial cycles influence capital equipment purchases and aftermarket replacement timing.
  • Raw material cost volatility — including metals, advanced polymers, and manufacturing overhead — can compress margins if pricing lag occurs.
  • Sustainability and emissions regulations can both create opportunities and introduce compliance costs.

Despite these pressures, Donaldson’s improved operating margin and raised guidance suggest it navigates competitive pressures through innovation, pricing discipline, and efficient operations. Given ongoing investments and product development, the company remains well positioned relative to peers in filtration and engine components.


VI. DCI Stock Price Trends and Market Sentiment

In the immediate wake of the December 4 earnings release, DCI stock price exhibited positive movement. According to market data, shares traded near $90–$93 in the period following the earnings report, remaining near its 52‑week highs and reflecting investor confidence in the quarterly performance and outlook.

The market reaction — including a 7.5% surge the day after the earnings announcement — suggests that investors received the stronger‑than‑expected revenue and EPS figures, along with the raised guidance, as favorable signals.

Looking forward, DCI stock price dynamics will likely reflect:

  • Earnings growth consistency: Continued quarterly results that beat consensus and demonstrate margin expansion.
  • Guidance execution: Whether the company can achieve or exceed its full‑year sales and EPS guidance.
  • Macro industrial demand: Growth in end markets like construction, heavy equipment, and advanced industrial sectors.
  • Currency and cost management: Fluctuations in raw material prices and foreign exchange impacts on global operations.

Historical aggregate post‑earnings stock behavior indicates modest positive returns in the weeks after earnings announcements — though individual outcomes vary with market conditions.


VII. Conclusion: Reading the December Earnings Through a Strategic Lens

The December 4, 2025 DCI Financial Report represents a robust start to fiscal 2026 for Donaldson Company, Inc., showcasing revenue growth, double‑digit EPS expansion, operational leverage, and raised full‑year guidance. These results reaffirm the company’s competitive positioning, diversified revenue drivers, and strategic focus on efficiency and premium filtration solutions — all of which resonate with the long‑term narrative around Donaldson Company Earnings.

While revenue growth remains in the low single‑digit range, the improvements in profitability, operating margins, and cost management highlight a company turning modest top‑line gains into stronger bottom‑line performance. This is especially significant in an industrial landscape marked by mixed global economic signals, supply chain dynamics, and end‑market cyclicality.

For the broader investment community watching DCI stock, the December earnings and subsequent guidance raise important considerations: How effectively will Donaldson continue to balance growth, innovation, and margin expansion? Moreover, how will global industrial demand patterns and strategic investments in high‑growth filtration markets affect valuation sentiment in coming quarters?

The forthcoming quarters — especially as Donaldson reports Q2 and full fiscal 2026 data — will provide clearer evidence on whether this Q1 performance represents a sustained trend or an early‑cycle acceleration. Regardless, the December earnings offer a compelling snapshot of a company with operational momentum, strategic clarity, and a framework aimed at long‑term value creation.