At the opening of U.S. trading, Paramount Skydance (NASDAQ:PSKY) rose over 8%, Warner Bros Discovery (NASDAQ:WBD) gained nearly 3%, and Netflix (NASDAQ:NFLX) dropped more than 1%.
According to a statement released on Tuesday, Warner Bros and the streaming giant reached a waiver agreement that allows the company to engage with Paramount on the terms of its most recent offer over the next seven days. This decision came after a banker from Paramount informed Warner Bros board members that if the company agreed to restart negotiations, Paramount would offer at least $31 per share, a $1 increase over its previous proposal. The company also stated that the current offer is not its “highest and final” bid.
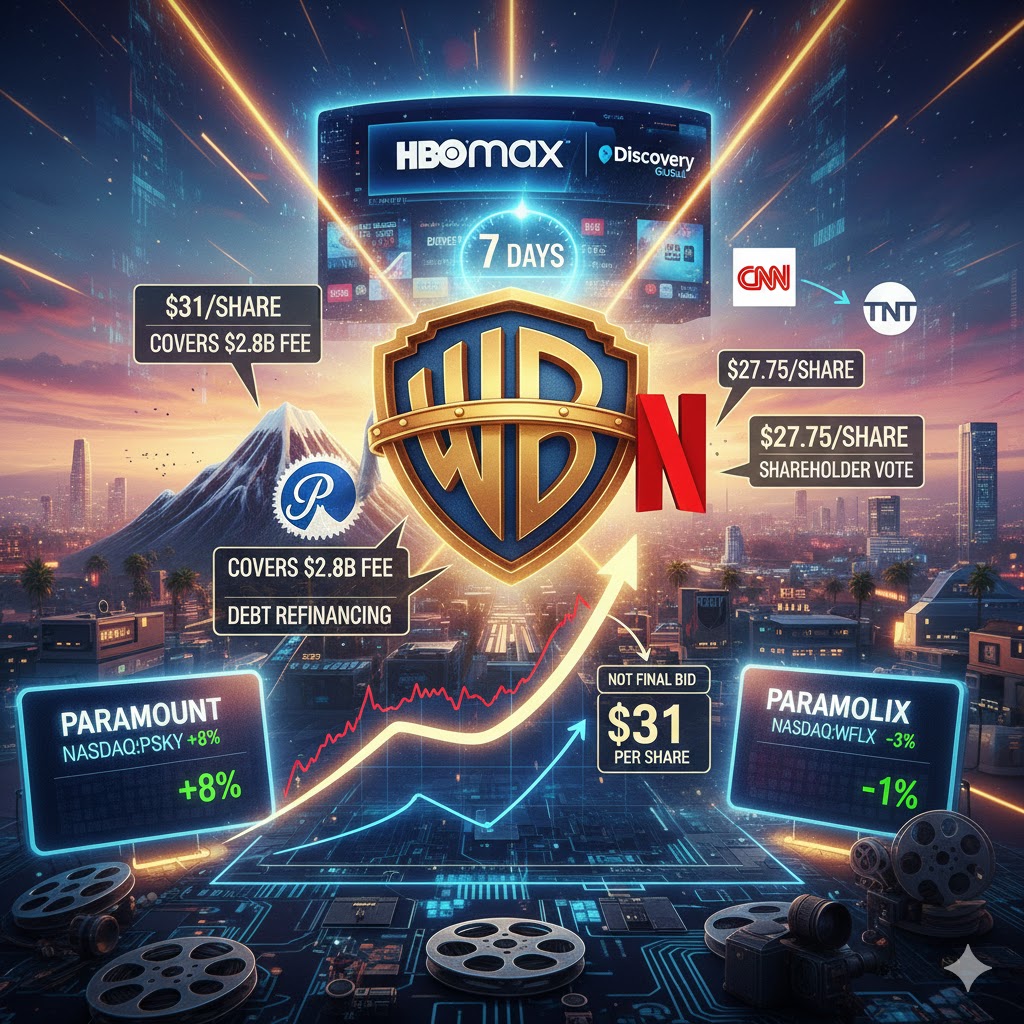
Warner Bros stated that its board still unanimously recommends that shareholders vote in favor of the binding agreement to sell its namesake film studio and HBO Max streaming business to Netflix for $27.75 per share. The company has scheduled a shareholder vote on the Netflix deal for March 20.
Warner Bros CEO David Zaslav said in the statement, “Throughout this process, our sole focus has been to maximize value and certainty for Warner Bros shareholders.”
The decision to re-engage with Paramount confirmed media reports. Prior to this, the hostile bidder Paramount Skydance submitted a revised bid on February 10, addressing several key concerns raised by Warner Bros’ board.
Under the waiver granted by Netflix, Warner Bros’ engagement with Paramount can continue until February 23. The statement noted that Warner Bros has requested Paramount to provide its “highest and final” offer and plans to discuss the remaining unresolved issues in the latest bid during this period.
If, after this negotiation period, Warner Bros’ board determines that Paramount’s proposal is superior, Netflix will have the right to match Paramount’s latest offer to keep its existing agreement intact.
Paramount has been attempting to acquire Warner Bros since September of last year, a move that led Warner Bros to formally put itself up for sale. The company had raised its bid several times before ultimately losing to Netflix. Three days later, Paramount launched a hostile offer to acquire Warner Bros at $30 per share.
Under the terms of the agreement with Netflix, Warner Bros’ cable television channels (such as CNN and TNT) will be spun off into a new company — Discovery Global.
Paramount, which aims to acquire all of Warner Bros’ operations, insists its deal is more favorable to shareholders and has spent recent months lobbying regulators and investors.
In Paramount’s most recent proposal, it agreed to take on the $2.8 billion fee owed to Netflix due to Warner Bros’ termination of the agreement and proposed securing refinancing for Warner Bros’ debt. Paramount also stated that if the deal is not completed by December 31, it will compensate Warner Bros’ shareholders, highlighting its confidence that the transaction will quickly receive regulatory approval.