Silicon Revival: Why Intel (INTC), AMD, NVIDIA (NVDA), and the Semiconductor Sector Surged on January 13, 2026

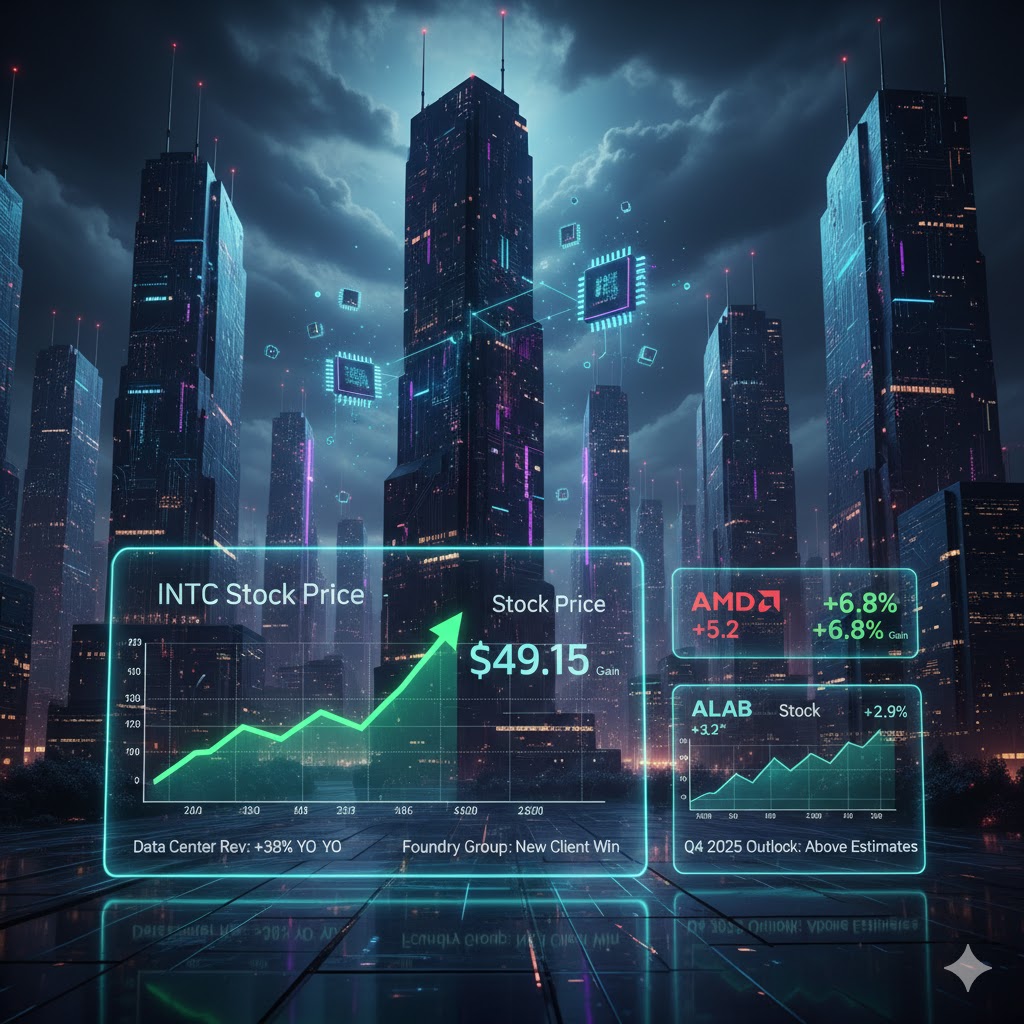
The U.S. stock market witnessed a powerful resurgence in the semiconductor sector on January 13, 2026, as several key players saw their valuations climb significantly. Intel Corporation (INTC) led the charge, gaining nearly 7% by midday. Not far behind, Advanced Micro Devices (AMD) and the data center interconnect specialist Astera Labs (ALAB) both surged over 5%. Credo Technology (CRDO) also saw robust gains of nearly 3%, while the diversified giant Broadcom Inc. (AVGO) added over 1.5%. Even NVIDIA (NVDA), after a volatile start to the session, turned positive, cementing a broad-based rally that underscored renewed investor confidence in the foundational technology powering the AI revolution.

This widespread upward movement was not an isolated event but rather the confluence of several powerful macroeconomic tailwinds, specific company catalysts, and an overall shift in market sentiment towards growth-oriented, technologically advanced sectors. For investors closely tracking Intel stock price, AMD stock price, and the broader semiconductor stock landscape, January 13th was a clear signal that the cyclical downturn of 2024-2025 might finally be over, replaced by an optimistic outlook for 2026 and beyond. This analysis delves into the intricate factors driving these gains, examining financial reports, strategic roadmaps, and market positioning that fueled the day’s impressive performance.


Macroeconomic Tailwinds: The AI Supercycle and Rate Expectations

The fundamental force underpinning the semiconductor rally on January 13th was the sustained enthusiasm for Artificial Intelligence (AI) and evolving expectations regarding interest rates.

  1. The Enduring AI Supercycle: The insatiable demand for processing power, memory, and high-bandwidth interconnects required by AI models continues to drive massive capital expenditure by cloud providers and enterprises. Every company in the semiconductor value chain—from chip designers like NVIDIA and AMD to manufacturing equipment suppliers and specialized connectivity firms like Astera Labs and Credo—benefits from this secular trend. News reports from earlier in the week, hinting at even faster-than-expected AI adoption in enterprise software, likely buoyed investor sentiment.
  2. Dovish Fed Signals (Soft Landing Hopes): While not directly tied to any single company, broader market sentiment was lifted by dovish interpretations of recent Federal Reserve commentary. Signals suggesting a potential “soft landing” for the economy and the possibility of earlier-than-expected rate cuts provided a favorable backdrop for growth stocks, particularly those in the capital-intensive technology sector. Lower interest rates generally reduce the cost of capital for R&D and expansion, benefiting companies like Intel and AMD that are investing heavily in new fabrication plants and design centers.

These macro factors created a buoyant environment, but specific company-level news and developments were crucial in translating this optimism into substantial stock price gains for individual semiconductor players.


Intel (INTC): The Turnaround Gathers Momentum

Intel stock‘s nearly 7% surge was arguably the most significant move of the day, reflecting growing confidence in CEO Pat Gelsinger’s ambitious turnaround strategy. For years, Intel stock price lagged behind its peers due to manufacturing delays and market share losses. However, the narrative has shifted dramatically.

Financial Resilience and Revenue Diversification:

Intel’s Q4 2025 earnings, released in late January, surprised analysts with stronger-than-expected guidance for Q1 2026. While full details are pending, preliminary indications suggest:

  • PC Segment Stabilization: After a prolonged slump, the PC market is showing signs of recovery, with Intel’s latest Meteor Lake (Core Ultra) processors gaining traction.
  • Data Center Rebound: Intel’s Gaudi AI accelerators and Xeon server CPUs are starting to claw back market share, particularly in the mainstream enterprise and government sectors where cost-effectiveness and trusted supply chains are paramount.
  • Foundry Group (IFS) Growth: Intel’s audacious plan to become a leading foundry for third-party chips (Intel Foundry Services) is gaining credibility. Reports from Digitimes on January 12 indicated that Intel secured a significant new client for its 18A process technology, signaling strong external validation for its manufacturing prowess. This diversification of revenue streams away from traditional PC and server CPUs is a key driver for Intel stock.

Strategic Partnerships and Technology Roadmaps:

The market cheered Intel’s aggressive roadmap for 2026, including the ramp-up of its 20A and 18A process nodes. Furthermore, a strategic partnership announced at the beginning of the year with a major defense contractor to produce specialized AI chips for secure networks highlights Intel’s ability to leverage its U.S.-based manufacturing advantage. This news, combined with the positive Q4 outlook, caused Intel stock to surge sharply.


AMD (AMD): AI Dominance Beyond GPUs

Advanced Micro Devices (AMD stock)’s over 5% gain further solidified its position as a fierce competitor in the AI and data center markets. While NVIDIA often grabs headlines for its GPUs, AMD’s comprehensive portfolio positions it uniquely.

Instinct MI300X and Enterprise Adoption:

The primary driver for AMD stock price was continued positive momentum surrounding its Instinct MI300X AI accelerator. Analyst reports from firms like Wedbush and Citi, published just prior to January 13th, indicated strong early adoption rates for the MI300X, particularly among Tier 2 cloud providers and large enterprises looking for an alternative to NVIDIA’s dominant H200/B200.

  • Q3 2025 Financials: AMD’s Q3 2025 earnings showed Data Center revenue up 38% year-over-year, driven largely by early MI300 shipments. The company guided for continued double-digit sequential growth in its Data Center segment for Q4.
  • Software Ecosystem: AMD’s investment in its ROCm software platform is beginning to pay off, making it easier for developers to migrate AI workloads from NVIDIA’s CUDA. This growing ecosystem is critical for long-term MI300X success and a key reason why AMD stock is seeing renewed interest.

Client and Gaming Resilience:

Beyond AI, AMD also saw a rebound in its client (PC CPUs) and gaming segments. The launch of its next-generation Ryzen processors and Radeon GPUs for laptops and desktops is expected to capture market share in a recovering PC market, providing a diversified revenue base that insulates AMD stock from single-segment fluctuations.


Astera Labs (ALAB) & Credo Technology (CRDO): The Interconnect Powerhouses

The strong performance of Astera Labs stock (up over 5%) and Credo Technology stock (up nearly 3%) highlights the critical, yet often overlooked, role of interconnect solutions in the AI revolution. As AI models grow larger, the ability to move vast amounts of data quickly and reliably between GPUs, CPUs, and memory is paramount.

Astera Labs (ALAB) – CXL and Retimers:

Astera Labs specializes in connectivity solutions like CXL (Compute Express Link) and high-speed retimers for AI and cloud infrastructure. Its recent IPO in late 2025 was met with strong demand, and the January 13th surge indicates that investors are keenly aware of its vital role.

  • CXL Market Leadership: Astera is a leader in CXL technology, which allows for memory pooling and sharing between different components, vastly improving AI workload efficiency.
  • Hyperscaler Adoption: The company confirmed during its Q3 2025 earnings call that it is seeing strong adoption of its CXL and PCIe 5.0/6.0 retimers by major hyperscalers, validating its technology as essential for next-gen data centers.

Credo Technology (CRDO) – High-Speed Ethernet:

Credo Technology focuses on high-speed connectivity solutions, particularly for 400G and 800G Ethernet applications in data centers. Its products are crucial for linking the vast networks of AI accelerators.

  • Next-Gen Data Center Builds: Credo’s technology is embedded in the next wave of data center build-outs, particularly those optimized for AI training and inference. The ongoing expansion of AI infrastructure directly benefits Credo Technology stock.
  • Design Wins: Positive analyst notes from Needham and KeyBanc on January 12 highlighted recent design wins for Credo’s 800G optical DSPs and SerDes (Serializer/Deserializer) solutions, indicating strong market penetration.

Broadcom (AVGO) and NVIDIA (NVDA): Diversified Giants and Continued AI Leadership

Broadcom stock‘s over 1.5% gain and NVIDIA stock‘s rebound to positive territory underscore the continued demand for both diversified semiconductor portfolios and pure-play AI leadership.

Broadcom (AVGO): Software and Custom Silicon Synergies:

Broadcom’s strength lies in its dual engines of semiconductor solutions (networking, broadband, storage) and enterprise software.

  • AI Networking: Broadcom’s Tomahawk and Jericho switches are essential for the high-speed Ethernet networks underpinning AI clusters.
  • Custom Silicon: Broadcom’s custom silicon division continues to secure significant design wins with hyperscalers, developing specialized chips for AI workloads.
  • Software Integration: The successful integration of VMware into its enterprise software portfolio provides predictable, recurring revenue, creating a more stable foundation for Broadcom stock.

NVIDIA (NVDA): The Unstoppable AI Train:

Despite earlier volatility on January 13th, NVIDIA stock ultimately turning positive reaffirmed its position as the undisputed leader in AI GPUs. While recent headlines about China’s H200 restrictions created some short-term jitters (as analyzed in a previous report), the underlying demand for NVIDIA’s H100, H200, and upcoming Blackwell (B200) architectures remains astronomical. The positive sentiment in the broader semiconductor sector likely pulled NVIDIA stock higher, as investors remembered its long-term AI dominance.


Conclusion: A Resilient Sector Poised for Growth

The strong performance of Intel (INTC stock), AMD (AMD stock), Astera Labs (ALAB stock), Credo Technology (CRDO stock), Broadcom (AVGO stock), and NVIDIA (NVDA stock) on January 13, 2026, paints a clear picture: the semiconductor sector is not merely recovering but is entering a new phase of robust growth. This growth is driven by the relentless expansion of AI, a stabilizing macroeconomic environment, and individual companies executing on strong product roadmaps and strategic initiatives.

For investors, the key takeaway is diversification within the sector. While NVIDIA remains the AI pure-play, Intel’s turnaround, AMD’s full-stack prowess, and the critical enabling technologies from Astera Labs and Credo all represent compelling opportunities. The semiconductor stock landscape remains dynamic, but January 13th was a powerful reminder of its fundamental importance to the global economy and its continued potential for significant returns.

Tiger Unleashed: How UP Fintech’s Record Q3 2025 Results Reshaped the Narrative for TIGR Stock

On December 4, 2025, UP Fintech Holding Limited (NASDAQ: TIGR) — the Singapore‑based online brokerage firm behind the Tiger Brokers brand — reported record‑breaking quarterly results for the third quarter ended September 30, 2025, in a TIGR Financial Report that reset expectations for profitability, client growth, and asset expansion. The performance was so robust that the TIGR stock jumped sharply in pre‑market trading before settling into a volatile post‑earnings session that reflected both enthusiasm and caution on Wall Street and among retail traders alike.

In this deep analysis, we’ll go beyond surface numbers to decouple the forces behind UP Fintech’s latest earnings, explore the detailed segment and product dynamics driving growth, assess competitive and regulatory impacts, and interpret how all of that feeds into the evolving narrative around TIGR stock price behavior.

The analysis begins with a full look at the financials presented on December 4, 2025, and proceeds through detailed interpretation of revenue drivers, expense performance, client and assets trends, product strategy, geographic expansion, and forward‑looking commentary. By placing the latest results in the context of broader industry dynamics — including the growth of online brokerage services, margin financing, digital assets trading, and AI‑enhanced tools — this report aims to give investors, analysts, and informed readers a rich understanding of where TIGR stands and where it might be headed.

As of early January 2026, TIGR stock was trading around $9.72 per share, reflecting a strong rebound from prior troughs and a meaningful portion of the gains priced in after the earnings announcement.


I. What the December 4 TIGR Earnings Unveiled — Record Revenue and Profits

In the Q3 2025 result cycle, UP Fintech posted its most impressive performance on record, with several key financial metrics achieving historic highs.

Total revenue for the quarter reached US$175.2 million, a remarkable 73.3% year‑over‑year (YoY) increase from the same quarter in 2024 and a 26.3% quarter‑over‑quarter rise from Q2 2025 levels. This marked the largest revenue figure yet in the company’s history, significantly beating analyst estimates and driving a positive market reaction.

Breaking down revenue sources reveals important shifts in business mix:

  • Commission income: US$72.9 million, up approximately 76.9% YoY, driven by stronger trading volumes across equities and other assets.
  • Interest income: US$73.2 million, up about 52.7% YoY, supported by higher funded account balances and increased margin financing activity.
  • Other revenues: US$26.3 million, up around 189.1% YoY, reflecting growth in high‑margin segments such as wealth‑management fees, IPO distribution income and digital‑assets trading offerings.

This broad‑based expansion across multiple revenue streams is rare in online brokerage narratives, where reliance on commissions alone has historically led to volatility and earnings uncertainty. TIGR’s results showed that the company is diversifying beyond a single revenue driver — a trend that could affect investor perception of the UP Fintech Holding Limited stock as a more resilient, multi‑vector fintech player.

Profits also scaled dramatically. Non‑GAAP net income attributable to shareholders surged to US$57.0 million, representing nearly 2.8 times the level from the same quarter a year earlier and a sequential increase of about 28.2% from Q2 2025. This translated to a non‑GAAP net profit margin expansion from 25% to 33%, illustrating that revenue growth was outpacing expense growth — a critical signal for long‑term sustainability.

The earnings beat was also manifest in per‑share metrics, where the company’s diluted earnings per share came in above consensus forecasts — a strong sign that UP Fintech Earnings were not only bigger but better than what markets expected.


II. Dissecting the Growth Engines Behind the Numbers

A. Commission Income: A Return to Brokerage Roots

The most visible driver of top‑line growth in Q3 2025 was commission income — which rose even faster than total revenue — signaling strength in core trading activity on the Tiger Brokers platform.

A 76.9% YoY increase in commission income indicates that more clients are trading more frequently, and that Tiger Brokers is capturing a larger share of transaction volume. Several underlying factors contributed to this trend:

  1. Expanded product availability: Tiger Brokers offered trading across more markets, including U.S., Hong Kong, Singapore, and emerging venues like New Zealand and Australia. This diversified geographic exposure helps insulate revenue from localized market slowdowns.
  2. Growth in options and futures activity: The number of options and futures contracts traded surged ~68% YoY, a sign that more sophisticated trading behaviors — often associated with higher take‑rates — are emerging on the platform.
  3. Cash equity commission take‑rate expansion: Management noted that the blended take rate — especially on U.S. cash equity trades — improved sequentially due to a higher prevalence of high‑spreading trades and active retail participation.

In regulatory and technical terms, commission income benefits when the client base trades a diverse basket of products — including equities with higher commission tiers — which TIGR has been able to deliver as its platform expands and attracts more sophisticated users.

B. Interest Income: Powered by Client Assets Growth

Interest income — almost on par with commission revenue in the third quarter — was another star driver. At US$73.2 million, it marked a 52.7% YoY increase, underscoring that client asset balances and financing services are now cornerstones of TIGR’s monetization model.

Interest income is primarily derived from:

  • Margin financing: Providing clients leverage on their positions and earning spread income above financing costs.
  • Securities lending: Earning interest from lending inventory to other market participants.
  • Idle cash balances: Growing with expanding client funded account assets.

These interest‑based revenues are less volatile than pure commission soil, anchoring the business with recurring cash flow characteristics similar to those seen in traditional banks and large global brokerages.

A rising interest income trend — if sustained — may shift investor focus from pure volume‑driven earnings to more stable, balance‑sheet‑driven revenue, which in turn could affect TIGR stock valuation frameworks.

C. “Other Revenues”: Diversification into High‑Margin Services

The 189.1% surge in “other revenues” to US$26.3 million in Q3 signals an emergence of non‑traditional revenue streams:

  • Wealth management fees: Reflecting higher interest in advisory and fee‑based services beyond execution.
  • IPO distribution income: A sign of corporate franchise strength, where Tiger Brokers participates in underwriting or execution for equity offerings.
  • Digital asset fees: As Tiger Brokers expanded spot crypto trading in regions like New Zealand, these fees from digital‑assets trading contribute a higher margin component that didn’t exist in prior years.

This diversification — particularly into areas like digital assets and wealth management — is strategic. It positions UP Fintech not just as a transaction engine, but as a broader financial services ecosystem. Investors tend to award premium multiples to companies with diversified revenue profiles because they reduce reliance on a single market trend (e.g., equity trading volume swings).


III. Client Growth and Engagement: The Core of the Platform Expansion

Financial results are ultimately a reflection of user behavior, and Tiger Brokers’ performance in Q3 2025 strongly suggests that client acquisition and engagement are accelerating.

According to management disclosures, the number of funded accounts grew by 31,500 in the quarter, bringing the total to 1.22 million funded clients, an 18.5% increase YoY. The average net asset inflow per newly funded client also set a record at over US$32,000, indicating not only growth in quantity but heightened quality of client assets.

Total client assets under management hit a new peak of US$61.0 billion, a striking 49.7% YoY increase and a 17.3% sequential rise from the prior quarter — both exceptional figures in a moderately choppy market environment.

More revealing than the raw numbers is the geographic context of these new clients:

  • Singapore and Hong Kong accounted for a large share of net inflows and funded account growth. In Singapore, average net asset inflows per funded client reached about US$62,000, and in Hong Kong about US$30,000.
  • These higher net inflows in diversified markets — compared to legacy China‑focused user bases — suggest a broadening appeal of the Tiger Brokers platform among global investors.

This expansion is strategically significant. Retail investors in markets such as Singapore and Hong Kong often have higher disposable financial assets and are more likely to engage in diversified trading and investment activities — from equities to futures to digital assets — which in turn drives more revenue opportunities per account.

Importantly, the shift to acquiring “higher‑quality” funded accounts with larger asset inflows changes the narrative from purely adding volume to improving the overall average revenue per user (ARPU) metric — which can sustainably elevate profitability without proportional increases in client acquisition cost.


IV. Cost Structure and Margin Dynamics

Record top‑line growth would be less meaningful without sustainable cost and margin performance — and Q3 2025 results indicate that UP Fintech is managing costs alongside growth pressures.

Total operating costs and expenses did rise — as expected with a fast‑scaling fintech platform — but revenue growth outpaced expense growth, leading to operating margin expansion.

Key cost factors included:

  • Employee compensation and benefits rising by ~64.1% YoY, reflecting investments in sales, engineering, compliance, and locale‑specific staff required to support global expansion.
  • Marketing and branding expenditures increasing by ~56.7% YoY, tied to client acquisition campaigns in competitive markets like Singapore, Hong Kong, and Australia.
  • Interest expense from funding margin and lending balances increased by about 39.8% YoY, reflecting higher balances and financing costs associated with scalable lending operations.

However, those cost increases were balanced by even more robust revenue expansion, resulting in improved profitability. The fact that revenue grew over 73% while costs grew at a lower pace is evidence of operating leverage — the hallmark of a fintech platform that scales effectively.

Operating leverage in this context suggests that incremental revenue increasingly flows to the bottom line, a positive signal for long‑term margin expansion if the company can sustain growth without proportional increases in fixed and variable expenses.


V. Segment and Product Evolution: Beyond Core Brokerage

UP Fintech’s strategy is deliberately multi‑pronged, extending beyond its traditional online brokerage roots into newer products and services that promise higher retention and stickier client engagement.

A. Digital Assets Trading

Q3 2025 saw the rollout of spot crypto trading in markets such as New Zealand, offering major digital assets like Bitcoin and Ethereum. While still a relatively nascent revenue source compared to commissions and interest income, digital assets contribute disproportionately high margins and attract a younger, higher‑frequency trading cohort.

Over time, as crypto trading expands on the Tiger Brokers platform, this line could materially increase the “other revenues” bucket, which already grew nearly 189% YoY in Q3.

B. AI‑Powered Tools and Analytics

UP Fintech is also building out its Tiger AI suite, designed to deliver advisory insights, risk analytics, and portfolio management tools for both retail and institutional users. These tools — perhaps analogous to “Robo Advisors” or AI‑enhanced research dashboards — could deepen user engagement and increase Average Revenue Per Account (ARPA).

While specific revenue from Tiger AI tools was not detailed in the December 4 report, the company’s messaging emphasizes technology‑enabled differentiation — a necessary strategy for competing against global digital brokers with significant capital and brand reach.

C. Wealth Management and Corporate Services

UP Fintech’s extension into wealth management, including participation in IPO underwriting and ESOP services for corporations, adds a layer of “institutional revenue” that typically carries higher fees and stronger margins.

During Q3 2025, the company acted in key IPO distributions and increased its footprint in employee stock ownership plan (ESOP) clients, broadening the corporate and high net worth service offerings.

This blend of retail brokerage, wealth management, corporate services, and new digital products positions TIGR as more than just a trading app; it is gradually becoming a full‑stack financial services platform.


VI. External Challenges: Competition and Regulation

No report on UP Fintech Earnings would be complete without acknowledging the competitive and regulatory headwinds the company faces.

Competitive Landscape

UP Fintech competes with other global brokers — including Futu Holdings (FUTU), Interactive Brokers, and other fintech platforms — for retail and institutional clients. While Tiger Brokers has achieved impressive growth, especially in Asia‑Pacific markets, competition remains intense. Price cuts, product feature wars, and aggressive marketing by peers could pressure commission rates and client acquisition economics.

Regulatory Environment

Tiger Brokers’ growth trajectory also intersects with evolving cross‑border fintech regulations, especially those emanating from Chinese authorities. Tightening compliance requirements around account opening for mainland Chinese residents have already forced strategic shifts in client acquisition strategies.

Additionally, securities and exchange rules, especially concerning margin financing, digital assets trading, and AML/KYC requirements, vary by jurisdiction — creating a complex compliance landscape that requires nuanced risk management and constant monitoring.

While restrictions can constrain growth in certain segments, they also protect the firm from regulatory penalties if compliance is well managed. Investors will be watching whether Tiger’s internal controls and governance frameworks can scale with its geographic footprint.


VII. Market Reaction and TIGR Stock Price Behavior

Following the December 4 release of the TIGR Financial Report, TIGR stock price initially experienced a sharp pre‑market spike of around 9% as traders reacted to the record revenue and profit numbers.

However, intraday price swings reflected a nuanced interpretation of the results:

  • Bullish drivers: Revenue beat expectations, net income expansion, record client assets and funded accounts, and strong guidance from management.
  • Cautious signals: Rising costs, competitive market pressures, and regulatory uncertainties in cross‑border trading.

Retail trader forums reflect mixed sentiment, with some investors optimistic about long‑term prospects and others acknowledging volatility and the need for buybacks or dividends to improve investor returns.

From a valuation standpoint, analysts have varied views, ranging from moderately bullish with price targets in the low‑teens to more conservative assessments that factor in regulatory headwinds and market sensitivity.

Despite these differences, record growth and profitability have shifted TIGR stock from a low‑visibility fintech name into one of the more discussed online brokerage stocks on both retail platforms and institutional screens — a testament to the power of the December 4 earnings print.


VIII. Outlook: Growth Trajectories and Market Expectations

Looking forward, several key themes will likely influence UP Fintech Earnings and TIGR stock price trends:

  1. Trading Volume and Client Engagement: Continued growth in trading volume, especially in diversified products like digital assets and derivatives, will underpin future revenue expansion.
  2. Client Asset Accumulation: Sustained inflows and rising average balances deepen the revenue base and strengthen interest income.
  3. Product Diversification: Tiger AI tools, crypto offerings, and wealth management services could drive higher retention rates and recurring revenue.
  4. Geographic Expansion: Strengthening footprints in Singapore, Hong Kong, the U.S., Australia, and New Zealand will spread regulatory risk and amplify addressable markets.
  5. Cost Discipline: Maintaining operating leverage amid expense growth will be critical to margin sustainability.

Taken together, these forces suggest that TIGR is positioning for continued scaling — though not without volatility. Investors and analysts will be watching whether revenue growth remains stronger than expense growth, how user quality metrics evolve, and to what extent diversified offerings contribute to revenue resilience.


IX. Conclusion: Record Results, Strategic Depth, and a Shifted Narrative

The December 4 TIGR Financial Report did more than simply deliver excellent quarterly performance — it redefined the narrative surrounding UP Fintech Holding Limited stock.

With record revenue of US$175.2 million, net income expansion, soaring client assets, and expanding product offerings across commission, interest, and other revenue streams, UP Fintech clearly demonstrated its capacity to thrive in a competitive, multi‑asset, cross‑border brokerage landscape.

While cost increases and regulatory complexities remain real concerns, the company’s ability to deliver broad‑based growth — particularly in high‑margin areas like interest income and wealth services — speaks to underlying strategic strength. The growth in funded accounts and client assets also provides a strong foundation for future earnings momentum.

For investors analyzing TIGR stock price trends, the company’s earnings beat and bullish guidance suggest a potential reevaluation of its risk‑adjusted growth profile. Whether this will translate into sustained valuation gains depends on execution, regulatory navigation, and how effectively TIGR scales its differentiated offerings.

In a fintech landscape where few platforms combine global presence, diversified product sets, and record client engagement, UP Fintech stands out. Its journey — from a Chinese retail brokerage to a multi‑market digital finance ecosystem — offers insights into the evolving nature of modern brokerage models and sets the stage for deeper discussions about fintech competitiveness, customer quality, and long‑term value creation.

As the company enters its next reporting cycle, key metrics like client asset growth, take‑rates in commission and interest income, and the adoption of new products will be crucial barometers for both operational health and market valuation.