In recent filings submitted to the Federal Communications Commission (FCC), SpaceX revealed plans to launch its second-generation cellular Starlink system in 2027. The project aims to deliver “substantially enhanced” satellite-to-cell services, providing a connectivity experience comparable to terrestrial 5G networks.
This technological leap is closely tied to a pivotal acquisition finalized last September. SpaceX entered into an agreement with EchoStar (SATS) to acquire its wireless radio spectrum resources for approximately $17 billion to upgrade its cellular Starlink services. The transaction is expected to close by November 30, 2027, allowing SpaceX to assume EchoStar’s obligation to pay approximately $2 billion in cash interest on its debt. Filings indicate that while SpaceX has the option to complete the acquisition early, it would incur significantly higher costs.
Last autumn, SpaceX CEO Elon Musk stated that realizing this service requires a “roughly two-year timeframe.” He noted that the primary challenges are twofold: first, smartphone manufacturers must complete hardware adaptations to integrate EchoStar spectrum chips supporting the 1.9GHz and 2GHz bands; second, SpaceX must launch next-generation satellites capable of utilizing this additional spectrum. This includes a proposed new constellation of 15,000 satellites currently awaiting FCC approval.
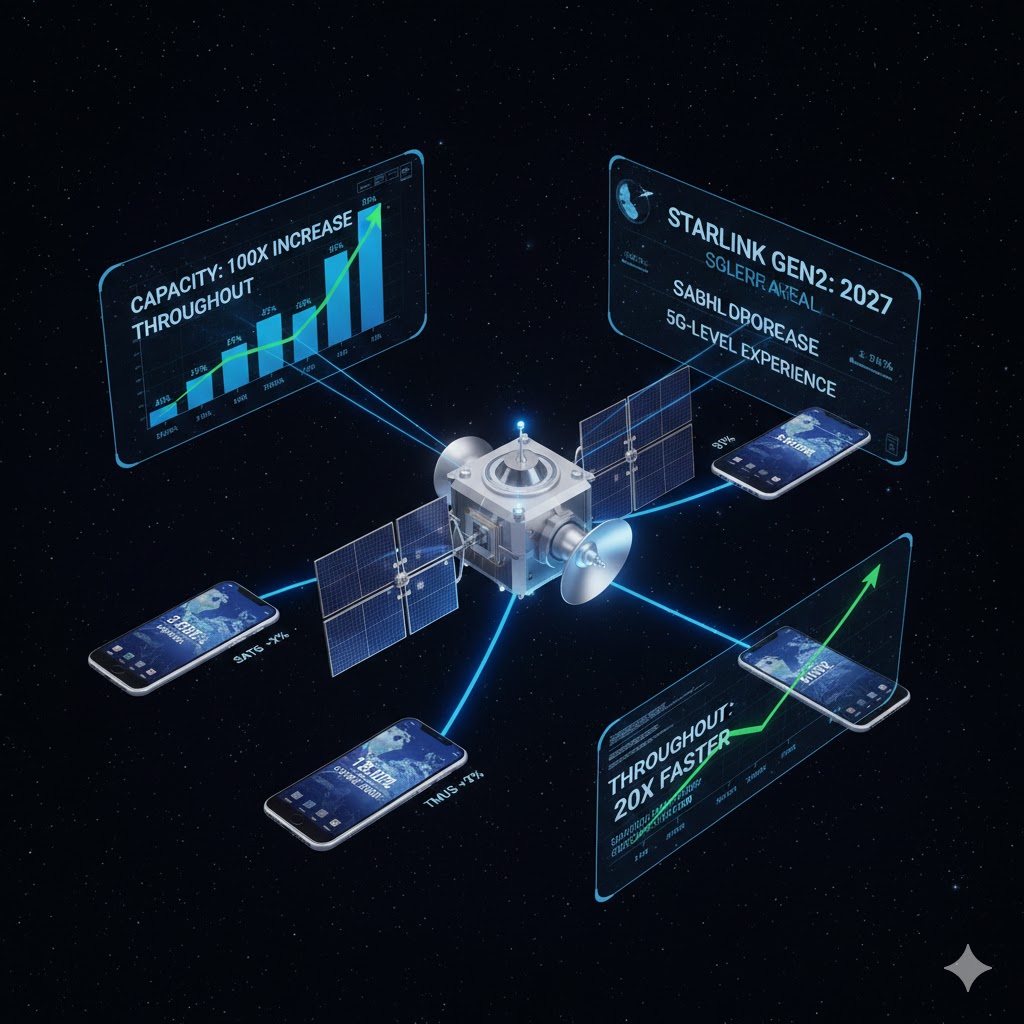
Achieving 5G-Level Direct-to-Cell by 2027 with a 100-Fold Capacity Increase
SpaceX currently offers its first-generation cellular Starlink service in the U.S. through a partnership with T-Mobile US (TMUS). While this technology provides essential data connectivity—including video calling, messaging, and app access—in areas with weak cellular coverage, its available bandwidth remains limited.
In contrast, the planned second-generation cellular Starlink system is expected to deliver a connection experience approaching that of terrestrial 5G networks. In technical documents, SpaceX pointed out that the total capacity of the next-generation system will be more than 100 times greater than that of the first-generation network, with data throughput capabilities increasing by over 20 times.
David Goldman, SpaceX’s Vice President of Satellite Policy, along with two other executives, stated in the filing:
“But this is just the beginning: SpaceX has invested in spectrum resources that will allow it to launch a substantially enhanced second-generation direct-to-device system in 2027.”
This statement suggests that the company is shifting its resources and focus toward the second-generation system. The new generation is anticipated to achieve significant breakthroughs in coverage, connection speed, and system capacity, aiming to align satellite communication services with the performance of terrestrial mobile networks.
If this rollout proceeds as planned, it will strengthen SpaceX’s competitive advantage in the satellite communications market and pose a direct challenge to both traditional telecommunications providers and emerging low-Earth orbit (LEO) constellation operators. As the 2027 window approaches, the progress of spectrum integration and system R&D will remain the critical variables determining the success of this strategy.