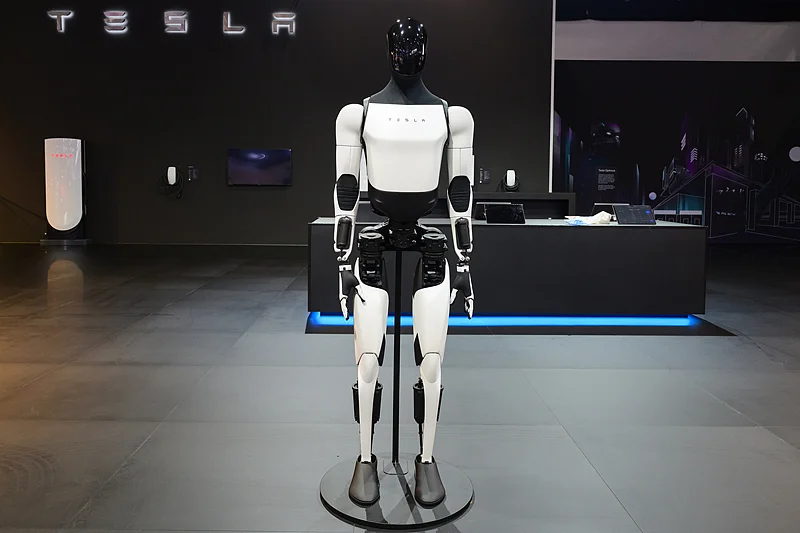
Author Archives: admin

Broadcom’s Strategic Leap: Deep Analysis of AVGO Stock, AI-Driven Growth, and Long-Term Market Dynamics

Financial Performance and Profitability Trends

Top-Line Growth Momentum

Across recent fiscal periods, Broadcom has delivered impressive revenue gains. In fiscal 2025, the company reported trailing-twelve-month revenue of approximately $63.89 billion, representing nearly 24% year-over-year growth compared to prior periods. This growth places Broadcom among the fastest-expanding revenues within major semiconductor peers. Profitability has remained robust with net income around $23.13 billion for the same period and a trailing-twelve-month EBITDA of approximately $35 billion, highlighting its high-margin model in both hardware and software businesses.

In the most recent earnings cycle, quarterly results (e.g., Q4 2025) indicate revenue of $18.02 billion, up roughly 28% year-over-year, while AI semiconductor revenue surged an estimated 74% year-over-year to $6.5 billion. Free cash flow also climbed, strengthening Broadcom’s liquidity and ability to self-fund strategic investments.

This consistent top-line acceleration underscores the company’s ability to capture more substantial portions of global semiconductor and enterprise infrastructure spending. Operating leverage is evident as adjusted EBITDA margins continue expanding above 60% in key periods, a notable achievement in a traditionally capital-intensive industry.

Balance Sheet Resilience

Broadcom’s balance sheet shows significant scale and financial flexibility. As of the latest official disclosures, total assets were reported in excess of $165 billion, while total liabilities decreased year-over-year, enhancing equity stability. Cash and short-term investments remain strong, supporting both operational needs and strategic moves such as acquisitions and capacity expansion.

The company’s free cash flow generation — on the order of nearly $27 billion annually — reinforces its ability to fund research and development, pursue infrastructure leadership, and sustain shareholder capital return policies without excessive leverage. These numbers matter for deep analysis of Broadcom stock fundamentals, especially when assessing long-term competitive positioning.

Profitability and Margins

Broadcom’s net margin of roughly 36% and operating margin of over *40% remain among the highest in the semiconductor industry, a testament to a profitable product mix and scalable software revenue streams. Gross margin exceeding *77% reflects the premium nature of custom ASIC chips and enterprise software, which command higher prices than commodity components.

These robust margins indicate that Broadcom is translating revenue growth efficiently into bottom-line strength, a key consideration for any detailed review of AVGO stock price drivers over time.


Business Development and Strategic Positioning

AI and Custom Silicon Leadership

Perhaps the most influential driver of Broadcom’s recent performance has been its deepening involvement in AI infrastructure — notably its custom silicon solutions (XPUs) tailored to hyperscale cloud providers and enterprise data centers.

Broadcom’s AI revenue trajectory has been remarkable. In several recent quarters, AI-related semiconductor revenues grew at high double-digit — and in some quarters triple-digit — year-over-year rates. For example, in fiscal Q1 2025, AI semiconductor revenue reportedly rose around 77% to $4.1 billion. This shift is not merely a cyclical uptick; it reflects structural demand for data center components optimized for large-scale AI processing, connectivity, and networking.

The company’s strategic focus on custom ASICs differentiates it from more generalized semiconductor producers. These chips — designed to meet the specific performance, power, and efficiency requirements of proprietary AI workloads — attract long-term contracts with major cloud players such as Meta, Google, Microsoft, Anthropic, and others. A backlog valued at over *$73 billion of bespoke chip orders, extendable up to 18 months out, illustrates both strong demand and production planning complexity. This backlog, while promising substantial future revenue, also underscores critical supply chain alignment and capital allocation discussions for management.

Infrastructure Software Integration

Broadcom’s expansion into infrastructure software — particularly through its integration of VMware — provides a second major business pillar that mitigates cyclicality in semiconductor markets. As of fiscal 2025, infrastructure software accounted for roughly 42% of total revenue, encompassing enterprise networking tools, virtualization, security, and cloud management platforms.

This diversified revenue orientation enhances Broadcom’s resilience against semiconductor market downturns while positioning it to capture recurring subscription revenues from enterprise customers — a strategic advantage not shared by many peers strictly dependent on silicon sales.

Dividend and Capital Return Policies

Even as the company invests heavily in future growth areas, Broadcom has maintained a disciplined capital return framework. Over multiple consecutive years, quarterly dividends have grown, signaling confidence in cash flow sustainability. The dividend payout — while not historically high relative to some equity income stocks — demonstrates management’s commitment to balanced shareholder value creation alongside strategic reinvestment.


New Product Development and Technology Roadmap

Advanced Networking and AI Connectivity Solutions

Broadcom’s product roadmap centers on accelerating innovations in high-speed networking silicon, AI accelerator chips, and integrated connectivity platforms critical for next-generation data centers. With data center traffic expected to grow exponentially alongside AI-fueled workloads, Broadcom’s Ethernet switches, AI XPUs, and interconnect architectures stand at the core of enabling hyperscale computing infrastructures.

Technological development is occurring in close partnership with major foundries and ecosystem collaborators, including advanced packaging and leading-edge process nodes. For example, Broadcom’s supply chain partnerships extend into targeting leading process technologies such as 3nm/2nm-class wafers and advanced packaging techniques, ensuring competitiveness against peers.

Software-Defined Enterprise Solutions

Beyond hardware, Broadcom is increasing its software portfolio capabilities with integrated cloud-native and virtualization solutions, benefiting from the VMware acquisition. The evolution of combined hardware and software platforms allows Broadcom to offer more comprehensive infrastructure solutions — from data center silicon to orchestration layers — appealing to global enterprises seeking scalable, predictable performance.


Market Expansion and Competitive Landscape

Global Customer and Partner Footprint

Broadcom’s customer base includes many of the largest technology and enterprise organizations worldwide. Its customization model for AI silicon has secured long-term agreements with top hyperscalers, providing revenue visibility and strategic alignment with the AI acceleration trend.

The company’s delivery capacity — sustained by global supply arrangements and expanded packaging facilities — ensures readiness to meet growing demand. However, such capacity also highlights execution challenges; backlogs of large orders indicate strong demand but also potential fulfillment latency that could constrain near-term growth if not carefully managed.

Competitive Dynamics

Broadcom operates in a highly competitive environment where differentiation is driven by performance, energy efficiency, and ecosystem support. Competitors include Nvidia in AI accelerators, Marvell in networking silicon, and a host of emerging ASIC and AI chip developers worldwide.

Despite this competition, Broadcom’s integrated approach — spanning custom AI silicon, high-speed networking, and software ecosystems — offers a unique value proposition. Its role in essential infrastructure components enables it to capture value from multiple layers of technology stacks.


Other Notable Events and Market Reactions

Recent Price Movements and Volatility

While Broadcom’s fundamentals have strengthened, AVGO stock price has experienced bouts of volatility. In late 2025, the stock endured its steepest three-day decline since March 2020, falling nearly 17.7%, reflecting investor reassessment of AI revenue timelines and customer concentration narratives.

This volatility underscores a broader theme experienced across growth-oriented technology stocks, where earnings beats can at times be offset by sentiment-driven trading dynamics. News coverage also highlights deals such as a reported ~$10 billion AI custom chip order from an unnamed customer — speculated in industry circles to be linked to OpenAI — which initially boosted shares and reinforced confidence in Broadcom’s AI strategy.

These events illustrate how market sentiment can amplify or temper fundamental achievements in the short term — an important context when tracing Broadcom stock performance and narrative shifts.


Forward Outlook and Strategic Considerations

AI-Driven Growth Potential

Broadcom’s deepening alignment with AI infrastructure growth suggests a robust multi-year runway. Analysts have projected that AI-related revenue could exceed $50–$60 billion within upcoming fiscal cycles, with some forecasting continued acceleration through the late 2020s as deployment of custom silicon becomes more widespread.

In this context, the company’s technological investments — particularly in networking and AI acceleration — signal readiness to exploit structural demand shifts toward cloud-native workloads, AI model training, and data center expansion.

Balanced Innovation and Risk Profiles

That said, transition toward custom AI silicon and large backlogs highlights an execution balance between capturing growth and managing supply chain constraints. Additionally, evolving competitive pressures — especially around specialized AI accelerators and open-source chipset development — require ongoing innovation to prevent technical obsolescence.


Conclusion: The Strategic Value at the Core of AVGO Stock

Broadcom’s performance across financial metrics, strategic positioning, and innovation execution underscores its role as a key infrastructure enabler in the semiconductor and enterprise technology ecosystem. AVGO stock price movements reflect both strong fundamental gains and the market’s nuanced expectations regarding AI revenue timelines and execution risk.

From record revenues driven by AI and networking solutions to diversified enterprise software revenues that buffer cyclicality, Broadcom’s multifaceted growth narrative remains at the forefront of industry transformation. For observers of Broadcom stock, understanding not only headline financial performance but also the interplay of strategic initiatives, product development trajectories, market expansion, and shifting investor sentiment offers a comprehensive view into one of the most consequential technology companies of the decade.

CM Stock Deep Dive: Unpacking Canadian Imperial Bank of Commerce’s December 4, 2025 Financial Report and Strategic Trajectory

When Canadian Imperial Bank of Commerce (TSX & NYSE: CM) reported its fourth quarter and full fiscal 2025 results on December 4, 2025, the banking world took notice. As one of Canada’s major financial institutions — and a core component of the nation’s “Big Five” banking system — CIBC’s performance not only provides insight into the health of the Canadian and North American banking sectors but also reflects how diversified financial services enterprises are navigating evolving economic headwinds, competitive dynamics, and strategic digital transformation demands.

The latest CM Financial Report revealed a combination of record revenue growth, robust earnings performance, credit quality trends, and strategic investments that together frame an important narrative for investors tracking CM stock. While the bank delivered results that beat market expectations, the CM stock price reaction underscored that investor sentiment often weighs broader economic signals as much as headline earnings beats. This report examines the financial results in depth, interprets trends, explores drivers behind changes in key metrics, and assesses how CIBC’s strategic direction may shape future revenue, profitability, and stock price behavior.


Canadian Imperial Bank of Commerce: Company Context

Founded in 1961 through the merger of the Canadian Bank of Commerce and the Imperial Bank of Canada, Canadian Imperial Bank of Commerce (CIBC) has grown into one of Canada’s largest financial institutions, serving individuals, businesses, and institutional clients across North America and internationally. With a diversified business model encompassing personal and business banking, commercial banking and wealth management, U.S. commercial operations, and capital markets, CIBC’s structure balances cyclicality across segments and geographies.

CIBC’s core strategic pillars include:

  • Canadian Personal and Business Banking – delivering retail, small business, and commercial banking services.
  • Canadian Commercial Banking and Wealth Management – focusing on corporate banking, wealth management advisory, and investment services.
  • U.S. Commercial Banking and Wealth Management – expanding CIBC’s presence south of the border through regional banking and wealth platforms.
  • Capital Markets and Direct Financial Services – encompassing investment banking, corporate financing, trading, and direct digital financial products.

These diversified revenue streams help insulate the bank against volatility in any single line of business and allow it to leverage cross-selling opportunities across its client base.


Key Financial Highlights: Understanding the December 4, 2025 Report

The CM Financial Report for the fiscal quarter ended October 31, 2025 and the full fiscal year presented a mix of strong growth and positive operational performance:

  • Revenue in the fourth quarter reached C$7.58 billion, up approximately 14% year-over-year, marking a record quarterly revenue for the bank.
  • Reported net income for Q4 2025 was approximately C$2.18 billion, up 16% year-over-year, and adjusted net income was approximately C$2.19 billion.
  • Adjusted diluted EPS for Q4 2025 was C$2.21, beating analyst forecasts (~C$2.07) and illustrating the bank’s capacity to convert revenue growth into meaningful shareholder earnings.
  • For the full fiscal year 2025, net income was approximately C$8.5 billion, significantly above the C$7.15 billion reported in 2024.
  • Return on Equity (ROE) improved to approximately 14.1% for Q4, aligning with CIBC’s stated medium-term target to sustain above-trend profitability.
  • CIBC maintained strong capital ratios, with a Common Equity Tier 1 (CET1) ratio of 13.3%, affirming regulatory capital strength.
  • The bank also announced a quarterly dividend increase from C$0.97 to C$1.07, reflecting confidence in future earnings and capital management discipline.

Taken together, these results depict a bank achieving record top-line performance while managing risk and returning capital to shareholders — hallmarks of a maturing financial institution in a competitive environment.


Revenue and Net Interest Income: What’s Driving Growth?

A deeper look at the revenue breakdown reveals several key contributors to CM stock performance in the fourth quarter:

Record Revenue Across Core Businesses

CIBC’s C$7.58 billion revenue in Q4 2025 represents meaningful growth relative to C$6.62 billion in the prior year quarter, driven by higher net interest income and fee-based income.

Net interest income — the difference between interest earned on loans and investments and interest paid on deposits — expanded, supported by higher average interest-earning asset yields and a firm net interest margin. In an environment where many banks struggled to balance deposit costs against loan yield pressures, CIBC’s ability to grow net interest income reflects both asset mix management and disciplined pricing.

Fee and non-interest income — derived from wealth management products, capital markets services, foreign exchange, and transaction fees — also contributed to total revenue growth. Wealth management and capital markets performance often serve as bellwethers for economic activity and investor confidence; positive growth in these areas suggests underlying client engagement and market participation.

Segment Contributions

The Canadian Personal and Business Banking segment provided a stable, resilient foundation for revenue growth. As a relationship-oriented business, this unit benefits from diversified product usage (e.g., mortgages, personal loans, deposits, and small business services) and cross-sell opportunities, which helped drive net interest income.

The U.S. Commercial Banking and Wealth Management segment showed particularly strong growth in net income — nearly doubling year-over-year — indicating that CIBC’s expansion strategy within mid-market U.S. banking and wealth advisory is producing tangible results.

Capital Markets also delivered robust growth, with reported net income up approximately 40% year-over-year, highlighting increased advisory and underwriting fees, higher transaction volumes, and improved market conditions for investment banking services.

Collectively, these diversified revenue streams helped CIBC mitigate the cyclicality often seen in banking — reinforcing the strategic value of a broad product portfolio.


Profitability, EPS, and Returns: A Closer Look

Diluted Earnings Per Share (EPS)

One of the most scrutinized metrics in the CM Financial Report was adjusted diluted EPS of C$2.21 for Q4 2025, which surpassed consensus forecasts (approximately C$2.07 per share). The beat reflects not only higher revenue but also relatively controlled expenses and effective cost management.

EPS growth — a critical driver of CM stock valuations — helps signal to the market that the bank is creating incremental value for shareholders. Growth in EPS, particularly when it exceeds forecasts, can boost confidence in future dividend sustainability and earnings leverage.

Return on Equity (ROE) and Operational Efficiency

CIBC’s ROE of ~14.1% underscores the bank’s ability to generate returns above its cost of equity, an important metric in banking where stable profitability is often rewarded with premium valuations. Efficient utilization of capital, coupled with growing adjusted net income, allowed CIBC to post disciplined ROE well above many peers.

Operating efficiency — typically measured by efficiency ratios (non-interest expense as a percentage of revenue) — also improved modestly, supported by digital investments that reduced incremental costs per transaction and streamlined back-office functions.


Credit Quality, Risk Management and Provisioning

No financial analysis of a major bank would be complete without examining credit risk and provisioning, especially for institutions like CIBC that carry large portfolios of loans and leases.

Provision for Credit Losses (PCL)

In Q4 2025, CIBC’s provision for credit losses was approximately C$605 million, up about 44% year-over-year due to changes in economic outlook and credit migration dynamics.

While an increase in provisions can initially be seen as a negative signal, moderate increases often reflect prudent risk management in anticipation of macroeconomic uncertainty or early signs of credit quality shifts. Importantly, CIBC’s loan loss ratios remained relatively stable, and provisions were offset by fee and interest income growth, indicating that loan portfolios were not materially deteriorating.

CIBC’s diversified credit portfolio — spanning retail, commercial, and corporate lending — also helped absorb risks in specific pockets of exposure, with historically strong underwriting and risk modeling frameworks smoothing volatility.

Maintaining a strong Common Equity Tier 1 (CET1) capital ratio of ~13.3% provided further cushion against credit and market stress, demonstrating that the bank’s regulatory capital is above minimum thresholds and aligned with industry best practices.


Dividend Policy and Capital Return Strategy

CIBC’s decision to increase its quarterly dividend from C$0.97 to C$1.07 — representing approximately a 10% raise — was a notable element of the December 4 Canadian Imperial Bank of Commerce Earnings announcement, signaling confidence in stable earnings and cash flow generation.

Dividend increases are often viewed by long-term investors as a tangible indicator that a company expects future profitability and cash availability to remain robust. In the context of the broader Canadian banking sector, where dividends carry significant weight in total shareholder return, CIBC’s commitment to an elevated dividend yield continues to make CM stock attractive to income-focused investors.

CIBC also actively engaged in normal course issuer bids (NCIBs) — share repurchase programs — reflecting confidence in repurchasing undervalued shares while improving capital efficiency and earnings per share via reduction of outstanding common shares.


Strategic Initiatives: Digital Transformation and Market Expansion

Digital and Technology Investments

During 2025, CIBC intensified investments in digital transformation, particularly in data analytics, automated advisory services, and digital banking platforms. These efforts aim to:

  • Enhance customer experience across mobile and online channels.
  • Reduce operational costs over the long term through process automation.
  • Capture market share among digitally native and younger demographics.

Investment in technology has dual benefit: supporting revenue growth via enhanced customer engagement and improving operational efficiency by lowering per-transaction costs. While near-term expenses increased due to these investments, the strategic payoff is expected to materialize over multiple years as adoption increases.


U.S. Growth and Cross-Border Strategy

CIBC’s strengthened presence in the U.S. market — particularly in commercial banking and wealth management — contributed materially to earnings expansion, with almost 92% year-over-year growth in U.S. commercial banking net income.

This cross-border strategy positions CIBC to benefit from:

  • Broader economic opportunities in U.S. commercial and mid-market segments.
  • Diversification away from solely Canadian domestic banking cycles.
  • Synergies between Canadian and U.S. wealth management and corporate banking.

Successful execution of this strategy hinges on continued integration of cross-border operations, regulatory compliance alignment, and talent investment in U.S. operations.


Macro Environment and Banking Sector Context

CIBC’s performance must also be interpreted within the broader macroeconomic and financial sector landscape:

  • Canadian banks have generally benefited from relatively stable economic growth, moderate inflation, and strong credit demand compared to many global peers.
  • Interest rate volatility — while challenging for deposit pricing — supported net interest income expansion during periods of rate hikes.
  • Housing market and consumer credit trends directly influence credit performance and loan growth dynamics.

Compared to global peers, Canadian banks like CIBC tend to exhibit more conservative credit portfolios and diversified revenue streams, which can help smooth cyclical swings and sustain shareholder returns.


CM Stock Price Trends and Market Perception

Current Pricing and Market Sentiment

As of early January 2026, CM stock price was trading around C$126.29 per share, within a 52-week range of approximately C$53.62 to C$128.87, reflecting significant appreciation year-over-year driven by strong earnings momentum.

The stock’s recent performance — including a dip following the December 4 earnings despite beating forecasts — illustrates that investors sometimes weigh broader macroeconomic signals (e.g., interest rates, credit conditions) as heavily as quarterly results. A notable observation is that banks often trade on forward expectations; solid earnings now may be discounted if investors anticipate slowing economic growth or rising credit risks.

Valuation Context

Analyst coverage for CM stock shows a consensus leaning toward buy or hold ratings, with average 12-month price targets suggesting upside potential relative to current prices. Forward price-to-earnings (P/E) multiples and price-to-book valuations often place CIBC in line with or slightly below its Canadian peer average, reflecting both conservative valuation and opportunities for rerating if growth accelerates.

Dividend yield and payout ratios, combined with share repurchase activity, contribute to total shareholder return models that many institutional investors incorporate into longer-term valuation frameworks.


Risks and Potential Headwinds

No analysis is complete without acknowledging risks that could influence CM stock price and future financial performance:

  • Credit Quality Deterioration: Increases in non-performing loans or significant asset quality stress could necessitate higher provisions, pressuring earnings.
  • Interest Rate Risk: A sudden shift in interest rate policy could squeeze net interest margins, especially if deposit costs rise faster than loan yields.
  • Regulatory Pressures: Changes in banking regulation (capital requirements, consumer protection rules) can influence capital allocation and operational costs.
  • Economic Slowdown: Broader economic contraction in Canada or the U.S. could constrain loan growth and weaken fee-based revenues.

Mitigating these risks will require disciplined underwriting, robust risk modeling, and strategic agility in adapting to market conditions.


Conclusion: CM Financial Report in Strategic Perspective

The December 4, 2025 CM Financial Report showcased Canadian Imperial Bank of Commerce’s continued stride toward record revenue and robust earnings performance, with diversified business units contributing to a balanced growth profile. Strong fundamentals — including net interest income expansion, diversified fee income, disciplined credit loss provisioning, and capital management — created a solid financial picture for fiscal 2025. The increase in dividends and sustained investments in digital transformation further reinforced the bank’s commitment to long-term shareholder value creation.

While CM stock price did not surge immediately following the earnings release, underlying fundamentals and strategic initiatives position the bank for potential revaluation should macroeconomic conditions remain supportive and earnings trajectories continue to rise. For investors and market watchers, the interplay between Canadian Imperial Bank of Commerce Earnings, capital return policies, and strategic growth execution will likely shape CM stock performance in the medium to long term.